Options data can get overwhelming quickly. Strike prices, open interest, volume, PCR — rows of numbers in an option chain can make it hard to interpret what the market is signalling.
- Key Takeaways
- What Is an Option Heat Map?
- How the Option Heat Maps Tool Works
- Core Features of the Paytm Money Options Heat Map
- Open Interest Analysis Across Strikes
- Max Call OI and Max Put OI Indicators
- Put Call Ratio (PCR)
- Volume PCR for Confirmation
- Colour Coded Visualisation
- Why Option Heat Maps Matter for Traders
- Holistic View of Market Commitment
- Where to Find the Option Heat Map on Paytm Money
- How Traders Use the Options Heat Map in Practice
- Interpreting Key Levels
- Combining With Other Indicators
- Strategy Planning
- Conclusion
- FAQs
The Option Heat Maps Tool on Paytm Money simplifies this into a clear visual dashboard. Instead of scanning data line by line, traders can instantly see where activity is concentrated, identify potential support and resistance levels, and gauge overall sentiment.
By converting key derivatives metrics into an intuitive colour-based format, the tool helps traders interpret market positioning faster and more efficiently.
Key Takeaways
- The option heat maps tool on Paytm Money converts complex option chain data into a visual dashboard
- It highlights key support and resistance levels using open interest
- Traders can quickly gauge market sentiment through PCR (Put Call Ratio) and volume data
- The tool saves time and improves clarity, especially during volatile sessions
What Is an Option Heat Map?
An option heat map is a visual representation of data from the option chain, primarily driven by open interest. Open interest refers to the total number of outstanding option contracts that are currently active in the market.
High open interest at a particular strike price indicates that many traders have positions at that level. This often highlights potential support and resistance zones, as price reactions tend to occur near heavily populated strikes.
On the Paytm Money platform, the options heat map sits within the F&O dashboard and allows traders to see the call and put activity without scanning through detailed tables.
How the Option Heat Maps Tool Works
The option heat maps tool on Paytm Money transforms numerical derivatives data into an intuitive graphical layout. The foundation of this tool is open interest, supported by volume and ratio based indicators.
By highlighting areas of intense market participation across different strike prices, the heat map allows you to spot where traders are most active without scanning through raw tables. It acts as a strategic dashboard, bringing advanced market insights directly to your mobile screen.
Core Features of the Paytm Money Options Heat Map
Open Interest Analysis Across Strikes
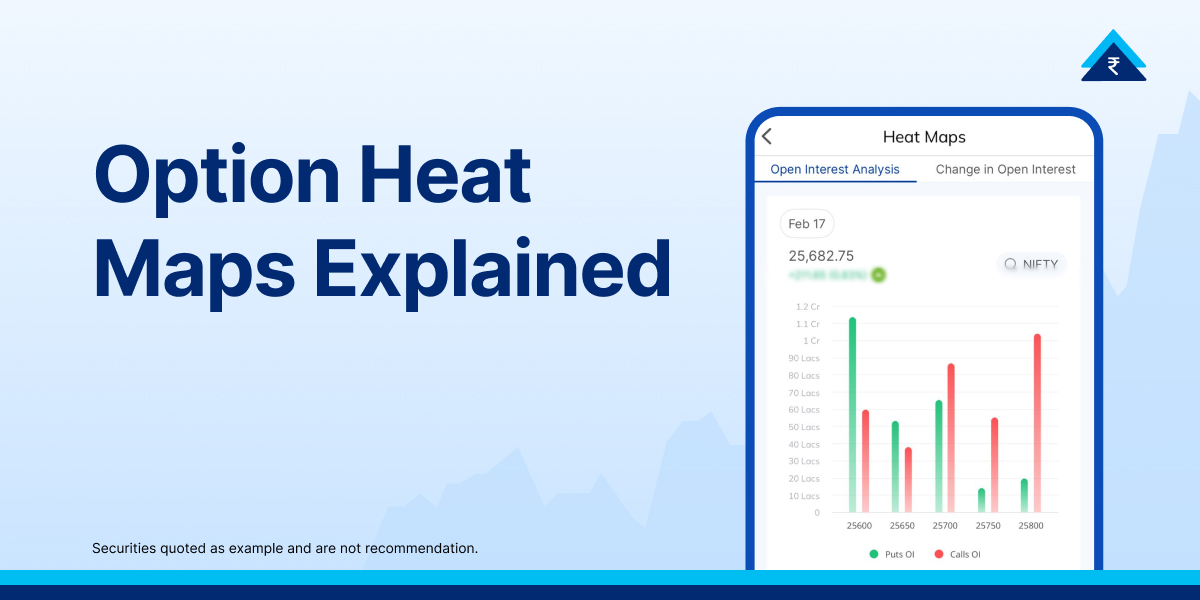
The heat map displays the distribution of call and put open interest across a wide range of strike prices. This analysis is available for popular indices such as NIFTY, BANKNIFTY, and FINNIFTY, and is also available for selected stocks. Each strike is represented visually, making it easy to identify where market participation is strongest.
Max Call OI and Max Put OI Indicators
One of the most valuable features of the tool is the clear identification of:
- Max Put OI Strike, often observed by traders as a potential support level
- Max Call OI Strike, which typically functions as a resistance level
These levels reflect where option writers have committed the most capital, offering traders important reference points.
Put Call Ratio (PCR)
The heat map displays the Put Call Ratio, a widely used sentiment indicator. For example, a PCR value such as 1.21 suggests that put open interest is higher than call open interest.
- A PCR above 1 usually signals bullish sentiment
- A PCR below 1 may indicate bearish sentiment
This ratio helps traders quickly assess the overall market bias.
Volume PCR for Confirmation
Alongside open interest, the tool also shows Volume PCR. This helps traders understand whether the observed open interest levels are supported by active trading. When both OI and volume align, the signal becomes more reliable.
Colour Coded Visualisation
The heat map uses clear colour cues:
- Green bars typically represent put open interest
- Red bars represent call open interest
The intensity and height of these bars highlight where market activity is most concentrated, making interpretation faster and more intuitive.
Why Option Heat Maps Matter for Traders
- Instant Market Sentiment: Instead of manually analysing an option chain, traders can immediately see whether the market leans bullish or bearish. The balance between call and put dominance becomes visible within seconds.
- Clear Support and Resistance Levels: High open interest strikes often behave as psychological barriers. The heat map allows traders to identify these zones without guesswork, improving timing for entries and exits.
- Intraday and Short Term Analysis: The Paytm Money heat map allows traders to toggle between open interest analysis and change in open interest, offering deeper insight into how market positions evolve during trading hours. By tracking changes in open interest in real time, traders can identify fresh position building, spot long or short buildup, and recognise the exit of existing positions.
- Faster Decision Making: The clean and uncluttered interface reduces information overload. This is especially useful for intraday traders and scalpers who operate during fast moving market conditions.
Holistic View of Market Commitment
Volume only shows how much trading has happened. Open interest shows how much money is still committed. The option heat maps tool on Paytm Money focuses on this commitment, helping traders understand where serious positioning exists for the current expiry. This gives retail traders access to insights that closely mirror institutional behaviour.
Where to Find the Option Heat Map on Paytm Money
Accessing the tool is straightforward:
- Open the Paytm Money app
- Navigate to the F&O section
- Scroll down towards the Trader Tools section and select Option Heat Maps tool
- Select an index or stock and open its Option Chain
- Switch to the Open Interest Analysis and Change in Open Interest tab
How Traders Use the Options Heat Map in Practice
Interpreting Key Levels
When price approaches a strike with heavy open interest, traders often anticipate slower movement or a reversal. These levels are treated as major reference zones.
Combining With Other Indicators
The heat map works best when used with:
- Implied volatility
- Option Greeks
- Price action and trend analysis
This combination improves trade quality and risk management.
Strategy Planning
Traders use insights from the heat map to:
- Plan entries and exits
- Adjust hedges
- Identify high liquidity zones
This leads to more informed and confident trading decisions.
Conclusion
The Paytm Money Options Heat Map goes beyond visual appeal to serve as a powerful analytical tool that converts complex derivatives data into actionable insights. By clearly highlighting key support and resistance levels and simplifying the assessment of market sentiment, it enables more informed and timely decision making.
In fast-moving markets where speed and clarity are critical, this visual approach offers traders a meaningful edge, making derivatives analysis more efficient, structured, and accessible.
Disclaimer: Investment in the securities market is subject to market risks. Read all the related documents carefully before investing. This content is purely for information purpose only and in no way is to be considered as an advice or recommendation. The securities are quoted as an example and not as a recommendation. Investors are requested to do their own due diligence before investing.
SEBI Reg No.: Broking – INZ000240532, Research Analyst – INH000020086, Depository Participant – IN-DP-416-2019, Depository Participant Number: CDSL – 12088800, NSE (90165), BSE (6707), MCX (57525), NCDEX (1315), MSEI (85300).
Registered Office: 136, 1st Floor, Devika Tower, Nehru Place, Delhi – 110019.
For complete Terms & Conditions and Disclaimers, visit https://www.paytmmoney.com.