Understanding where your money is invested can feel confusing at first. You may have selected a mutual fund based on returns, ratings, or recommendations, but have you ever wondered what companies actually sit inside your portfolio? The good news is that finding this information is easier than you think.
- Why You Should Check Mutual Fund Holdings
- 1. Download the Monthly Factsheet
- What Is a Factsheet?
- How to Access It
- What to Look For
- 2. Use the “Portfolio” Tab on Investment Platforms
- 3. Check Independent Research Websites
- Why Use These Platforms?
- What You Can Analyse
- 4. Use Consolidated Account Statement (CAS)
- What Is CAS?
- How to Generate CAS
- What You Will See
- How to Check Holdings on Paytm Money
- Benefits
- How to Read a Mutual Fund Factsheet
- Key Components Explained
- Important Metrics to Watch
- Understanding Riskometer
- Key Takeaways
- Conclusion
- FAQs
In this guide, you will learn how to find out which companies your mutual fund invests in using simple, reliable methods. This will help you make smarter investment decisions, avoid unnecessary risks, and stay in control of your money.
Why You Should Check Mutual Fund Holdings
Before diving into the steps, it is important to understand why checking mutual fund holdings matters.
Key Reasons
- Transparency: Know exactly where your money is invested
- Risk Management: Avoid overexposure to a single company or sector
- Better Decisions: Align investments with your financial goals
- Portfolio Clarity: Understand diversification across funds
1. Download the Monthly Factsheet
The most accurate way to check which companies your mutual fund invests in is through the monthly factsheet published by the Asset Management Company (AMC).
What Is a Factsheet?
A factsheet is a monthly document that contains:
- Complete list of stocks held
- Percentage allocation to each company
- Sector-wise distribution
- Fund performance and strategy
How to Access It
- Visit the official website of your AMC such as SBI Mutual Fund, HDFC Mutual Fund, or ICICI Prudential
- Go to sections like “Downloads”, “Investor Corner”, or “Portfolio Disclosure”
- Download the Monthly Factsheet for your specific scheme
What to Look For
Inside the factsheet, find the Portfolio Statement section. It typically looks like this (illustrative example):
| Company Name | Sector | Allocation (%) |
|---|---|---|
| Reliance Industries | Energy | 9.50% |
| HDFC Bank | Banking | 8.75% |
| Infosys | IT | 7.20% |
This table shows exactly how your money is distributed.
2. Use the “Portfolio” Tab on Investment Platforms
If you prefer a simpler and more user-friendly method, investment platforms can help. Popular platforms like Paytm Money make it easy to view your mutual fund holdings in a clear and organised way.
3. Check Independent Research Websites
Another effective way to find which companies your mutual fund invests in is through third-party research platforms. Popular websites like Value Research and Moneycontrol can help you easily analyse mutual fund portfolios and holdings.
Why Use These Platforms?
- Easy-to-read data
- Advanced analysis tools
- Portfolio comparison features
What You Can Analyse
- Market Capitalisation: Large-cap vs mid-cap vs small-cap
- Portfolio Overlap: Check if multiple funds hold the same stocks
- Credit Quality: Especially useful for debt funds
Pro Tip: Search your fund name and go to the Portfolio tab. You can quickly identify if you are investing in the same companies across different funds.
4. Use Consolidated Account Statement (CAS)
If you invest in multiple mutual funds, tracking each one separately can be time-consuming. This is where the Consolidated Account Statement (CAS) becomes useful.
What Is CAS?
CAS is a single report that shows:
- All your mutual fund investments
- Holdings across different AMCs
- Transaction history
How to Generate CAS
- Visit CAMS or KFintech websites
- Request a CAS using your PAN and registered email
- Choose the Detailed Portfolio Valuation option
- For a more modern experience, you can use MFCentral, which is a joint venture between CAMS and KFintech. It allows you to view and download a combined CAS directly after a simple OTP-based login.
What You Will See
Some detailed CAS reports include underlying holdings of your mutual funds, helping you understand your total exposure. However, note that CAS typically shows scheme-level details (units, valuation), and stock-level holdings may not always be included.
(Source: SEBI, AMFI, Kfintech, Mutual funds sahi hai)
How to Check Holdings on Paytm Money
If you are using Paytm Money, follow these steps:
- Open “Paytm Money app” and navigate to “Mutual Funds section”
- Select the “mutual fund” you want to explore from list
- Tap on the “fund name” to open detailed scheme page
- Scroll down until you find the “Scheme Holdings section” clearly
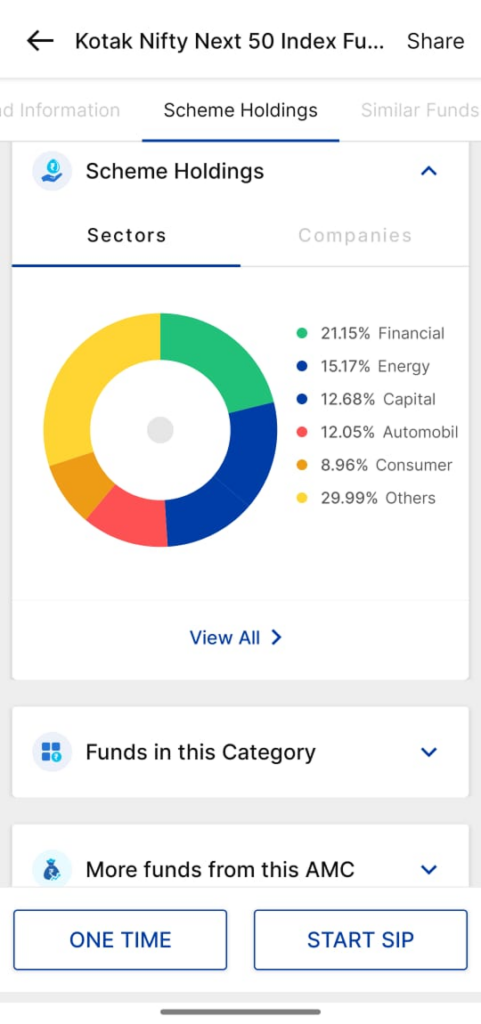
- Inside holdings, switch to the “Companies tab” for stock list
- Click on “View All” to see complete portfolio with allocations
You will now see:
- Complete list of companies
- Percentage allocation for each stock
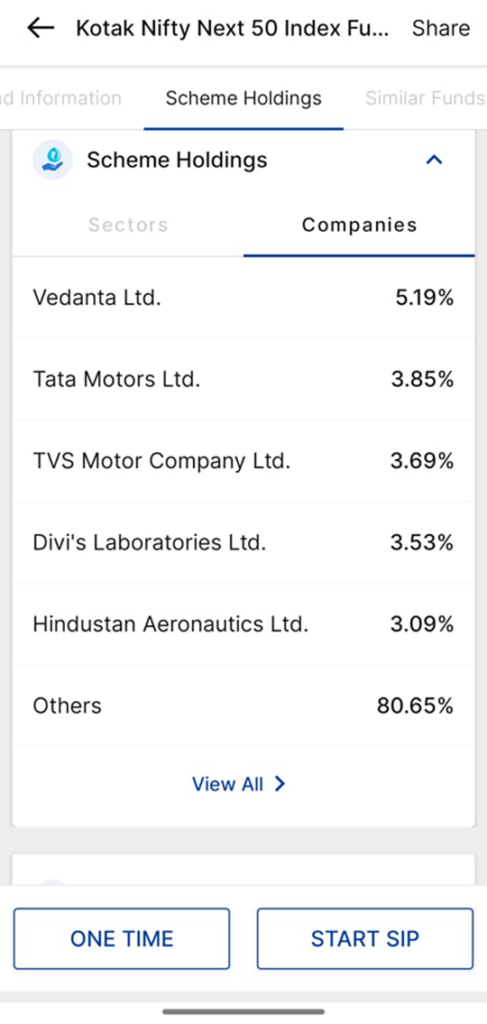
Benefits
- Quick and easy access
- Clear visual representation
- Helps track diversification
(Source: Paytm Money App)
How to Read a Mutual Fund Factsheet
Knowing how to find out which companies your mutual fund invests in is only half the job. You should also understand how to read the factsheet properly.
Key Components Explained
| Section | Meaning |
|---|---|
| Investment Objective | Fund’s goal and strategy |
| NAV | Current price per unit |
| AUM | Total assets managed |
| Exit Load | Fee for early withdrawal |
| Riskometer | Risk level indicator |
| Portfolio | List of holdings |
Important Metrics to Watch
- Concentration Risk: If a fund invests more than 10% in a single company, it can increase risk. As per regulations, funds typically have limits around this level, but higher exposure may still occur in certain cases.
- Style Drift: Check if the fund is sticking to its strategy. For example a large-cap fund should primarily invest in stable, large companies.
- Portfolio Overlap: If multiple funds you own invest in the same companies, your diversification reduces.
Understanding Riskometer
Mutual funds use a riskometer to indicate risk levels:
- Low: Minimal risk to the principal; typically associated with Liquid or Overnight funds.
- Low to Moderate: Slightly higher risk than liquid funds; often seen in Ultra Short Duration funds.
- Moderate: Medium risk; commonly found in Corporate Bond or Banking & PSU Debt funds.
- Moderately High: Significant risk; often applied to Hybrid or Large-cap Debt funds.
- High: Substantial risk to the principal; standard for most diversified Equity and Mid-cap funds.
- Very High: The highest risk level; typically assigned to Sectoral, Thematic, and Small-cap funds due to their extreme volatility.
For example:
- Equity funds usually fall under moderately high to high risk
- Liquid funds fall under low risk
Important Note on Timing: Mutual fund holdings are not updated in real-time.
- Data is usually updated monthly
- Portfolio reflects holdings as of the last day of the previous month
As per regulatory guidelines, mutual funds disclose portfolio holdings within 10 days after the end of each month.
This means:
- Recent changes may not be visible immediately
- Always consider a slight delay in data
Key Takeaways
- Use factsheets for the most accurate data
- Investment apps provide simplified views
- Research websites offer deeper insights
- CAS helps track all investments in one place
- Always check for diversification and risk
Conclusion
Learning how to find out which companies your mutual fund invests in is an essential step towards becoming a confident investor. It gives you clarity, control, and the ability to make informed decisions.
You do not need advanced financial knowledge to do this. With tools like factsheets, apps, and research platforms, you can easily track your investments and ensure they align with your goals.
Start reviewing your mutual fund holdings today. It is one of the simplest ways to improve your investment strategy.
Disclaimer: Mutual fund investments are subject to market risks. Read all the related documents carefully before investing. This content is purely for information purpose only and in no way is to be considered as an advice or recommendation. The securities are quoted as an example and not as a recommendation. Investors are requested to do their own due diligence before investing.
SEBI Reg No.: Broking – INZ000240532, Research Analyst – INH000020086, Depository Participant – IN-DP-416-2019, Depository Participant Number: CDSL – 12088800, NSE (90165), BSE (6707), MCX (57525), NCDEX (1315), MSEI (85300).
Registered Office: 136, 1st Floor, Devika Tower, Nehru Place, Delhi – 110019.
For complete Terms & Conditions and Disclaimers, visit https://www.paytmmoney.com.