Have you ever wondered why a mutual fund can deliver strong returns, but many investors in that same fund end up earning much less? For example, a mutual fund may generate an annualised return of 12% over five years, yet the average investor in that fund might earn only 8% to 9% during the same period. The fund performed well, but many investors did not fully benefit from that performance.
The reason often comes down to investor behaviour rather than the fund itself.
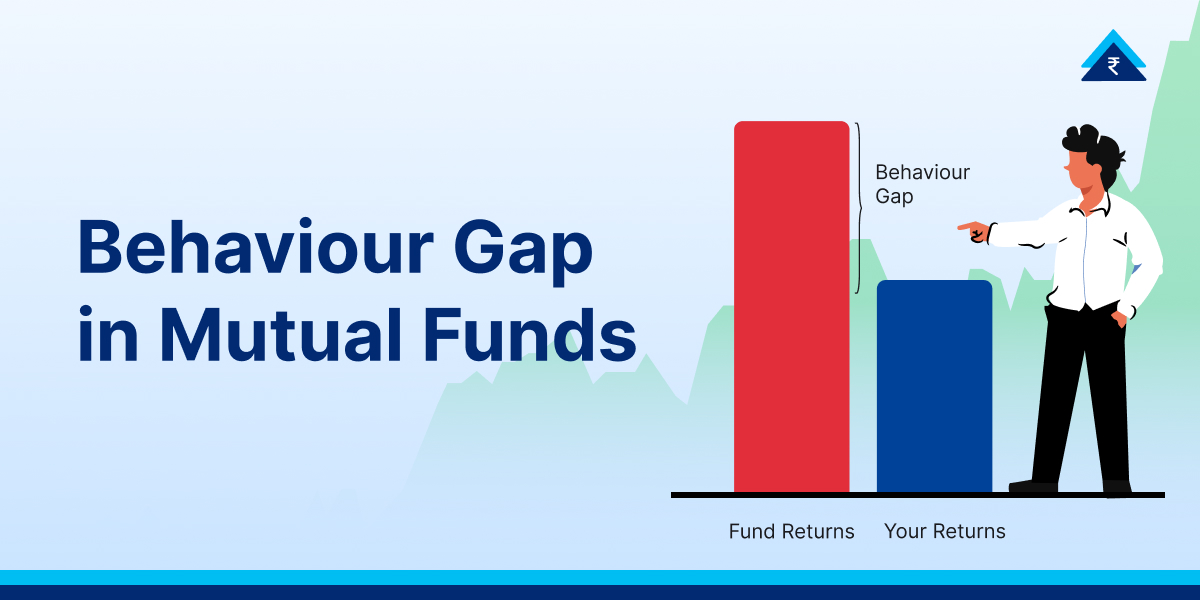
This difference between a fund’s return and the return actually earned by investors is known as the behaviour gap. It happens because investors do not simply invest once and stay invested. They add money after markets have risen, stop investing during downturns, switch funds based on recent performance, or redeem investments when markets become volatile. These decisions can significantly affect the returns they ultimately receive.
Understanding the behaviour gap is important because it highlights something investors can control. While market movements are unpredictable, investment behaviour is not. By recognising the habits that reduce returns and adopting a more disciplined approach, investors can improve their chances of capturing a larger share of the returns their investments generate.
In this article, we’ll explore what the behaviour gap is, why it occurs, the common mistakes that create it, and the practical steps investors can take to narrow it over time.
The Gap Between Fund Returns and Investor Returns
A fund’s published return, whether stated as a CAGR or a point-to-point figure, comes from the movement in its NAV over a period. It quietly assumes one thing: that you invested a single sum on day one and held it untouched until the end. No real investor lives like that.
In practice, people enter and exit at different points, add money when confidence runs high, withdraw when nerves take over, and jump ship after hearing about a friend’s better returns. Every one of those moves creates a timing mismatch between what the fund earned and what the investor captured. That mismatch is the behaviour gap in action.
How the Behaviour Gap Forms
The clearest way to see it is to follow a typical five-year journey.
| Period | What the fund does | What the investor does |
|---|---|---|
| Year 1 to 2 | Performs strongly | Stays cautious and invests a small amount, so the strong gains apply only to a small corpus |
| Year 3 | Now “top rated” | Raises the SIP or adds a lump sum, deploying large capital after the run, near the top |
| Year 4 | Market corrects | Watches the largest-ever position fall into loss; anxiety spikes |
| Year 4 (later) | Still down | Exits or stops the SIP near the bottom, crystallising the loss |
| Year 5 | Recovers strongly | Sits on the sidelines and re-enters only near the next high |
The fund’s five-year CAGR ends up strong. The investor’s actual return, weighted by the size and timing of each cash flow, lands well below it. The fund worked. The behaviour around the fund did not.
Note: Illustrative scenario, not based on specific fund data. The pattern of buying high after strong runs and selling low during corrections is well documented in investor behaviour research, both globally and in India.
Four Habits That Create the Behaviour Gap
The behaviour gap is not random bad luck. It grows out of four predictable habits, each of which feels completely sensible in the moment and each of which quietly trims your returns.
- Performance Chasing: Buying After the Rally: Investors often enter funds after seeing strong recent returns. By then, much of the growth may already be behind them. Investing large amounts at high NAVs can lead to lower returns if performance slows or markets correct.
- Panic Selling: Exiting During Market Corrections: Sharp market declines can trigger emotional decisions. Many investors sell near market lows to avoid further losses, only to miss the eventual recovery and re-enter later at higher levels.
- Overtrading: Switching Funds Too Frequently: Constantly moving between funds based on recent rankings can hurt returns. Frequent switches create tax liabilities, increase costs, and often result in buying recent winners after their strongest performance has already occurred.
- Stopping SIPs During Market Falls: Many investors pause SIPs during downturns, believing they are reducing risk. In reality, they miss the opportunity to accumulate more units at lower prices, which can significantly improve long-term returns.
The Psychology Behind the Behaviour Gap
These habits are not signs of a foolish investor. Each springs from a mental shortcut that served humans well elsewhere, just not in investing.
- Loss aversion: Research across many settings suggests people feel the sting of a loss roughly twice as keenly as the joy of an equal gain. So a ₹1 lakh fall tends to hurt about twice as much as a ₹1 lakh rise pleases. That imbalance is what fuels panic selling: the pain of holding overwhelms the knowledge that holding is the right move.
- Recency bias: The mind gives recent events more weight than they deserve. A fund that soared in the last 12 months feels destined to keep soaring, even though performance rarely persists that neatly. A 40% one-year return on a small-cap fund is vivid, so the brain treats it as a forecast, while a seven-year record that includes the rough patches feels distant and abstract.
- Social proof. Humans take cues from the crowd. When colleagues and social media contacts are cheering their returns, investing feels safe, which is partly why people pile in at peaks. The reverse holds too: when the mood is grim, investing feels dangerous, even though those moments often offer the most attractive entry points.
How to Close the Behaviour Gap
You cannot close the behaviour gap by simply trying to be more rational, because that is not how the mind works under pressure. You close it by building a structure that removes decisions from emotional moments.
- Automate everything you can: A SIP that debits automatically needs no monthly decision, so it cannot be derailed by a bad headline or a falling market. A running SIP takes effort to stop, and that friction works in your favour.
- Judge funds on three-year rolling returns, not the last 12 months: Rolling returns reveal consistency and are far harder to flatter with a single good or bad year.
- Pre-commit to a review calendar: Pick one month a year to review your portfolio, then refuse to check it at any other time, whatever markets do. The investor committed to a January review will not make the panic exit in September.
- Separate signal from noise: Ask whether new information concerns the fund’s long-term structure (a manager change, a strategy shift, a SEBI reclassification) or merely recent conditions (a quarterly ranking, news chatter, social media buzz). The first is signal. The second is almost always noise.
- Use goal-based framing: When each SIP is tied to a specific goal with a date, a correction stops feeling like destruction and starts looking like a discount, because this month’s SIP simply buys more units towards the same target.
What the Behaviour Gap Costs Over Time
The behaviour gap is not a one-off. It compounds, cycle after cycle, in much the same way returns do.
| Time horizon | Fund at 12% CAGR | Investor at 9% CAGR | Wealth lost to the gap |
|---|---|---|---|
| Year 5 | ₹17.6L | ₹15.4L | ₹2.2L |
| Year 10 | ₹31.1L | ₹23.7L | ₹7.4L |
| Year 20 | ₹96.5L | ₹56.0L | ₹40.5L |
A 3% annual gap sounds trivial. Over 20 years on a ₹10 lakh investment, it works out to roughly ₹40 lakh of wealth that never arrives. The behaviour gap is no rounding error. Over a long horizon it can be one of the biggest factors in whether you reach your financial goals.
Note: The above numbers are for illustrative purposes only. Assumes a ₹10 lakh lump sum, compound growth at the stated rates, and no further contributions. The 3% gap is used purely to show the compounding effect, and real gaps vary widely. These are not expected outcomes.
(Source: Paytm Money CAGR calculator)
What the Successful Investor Looks Like
The investor who keeps most of what their fund earns has no special market insight or timing gift. What they have is structure.
- They invest for defined goals, not vague “wealth creation”, which makes it easier to stay put because the question is concrete: is this goal still achievable? Usually, yes.
- They automate their investing, with SIPs on fixed dates rather than discretionary monthly decisions, so the money keeps flowing even when emotions would have hit pause.
- They review infrequently and deliberately, once a year in a calm moment, not every time markets lurch or a colleague mentions their returns.
- They pick funds on consistency, using rolling returns, benchmark comparison and category fit rather than this year’s rankings.
- They sit with discomfort without acting on it, feeling the urge to exit a falling portfolio and choosing to do nothing, because a pre-committed framework has already made the decision.
Conclusion
The behaviour gap is one of the biggest reasons investors earn less than their mutual funds deliver. While choosing a good fund matters, long-term success depends just as much on staying invested, avoiding emotional decisions, and following a disciplined approach. Habits such as performance chasing, panic selling, frequent switching, and stopping SIPs can quietly reduce returns over time.
The good news is that these mistakes are preventable. By automating investments, reviewing portfolios on a fixed schedule, focusing on long-term goals, and ignoring short-term market noise, investors can narrow the behaviour gap and capture more of their fund’s true potential.
Disclaimer: Investments in the securities market are subject to market risks. Read all the related documents carefully before investing. This content is purely for informational purposes only and should not be considered as investment advice or a recommendation. Securities quoted are for illustration purposes only and not recommendatory. Investors are requested to do their own due diligence before investing.
Paytm Money Ltd. SEBI Reg. No. Broking – INZ000240532; Depository Participant – IN – DP – 416 – 2019, Depository Participant Number: CDSL – 12088800. Trading and clearing member of NSE (90165, M52073), BSE (6707), MCX (57525), NCDEX (1315, M51110), and MSEI (85300). SEBI Reg. No. Research Analyst – INH000020086. Regd. Office: 136, 1st Floor, Devika Tower, Nehru Place, Delhi – 110019. For complete Terms & Conditions and Disclaimers visit: https://www.paytmmoney.com/stocks/policies/terms