

Understand the risk-reward ratio in trading, how to calculate it with ₹ examples, set stop-loss levels, and evaluate Paytm Money Trading Ideas.
- What Is the Risk-Reward Ratio?
- Why the Risk-Reward Ratio Matters
- A Simple Risk-Reward Ratio Example
- What Happens When You Change the Stop-Loss?
- How to Estimate Reward and Risk
- Risk-Reward Ratio in Paytm Money Trading Ideas
- Exit Rules to Remember
- Can the Risk-Reward Ratio Change Over Time?
- Points to Consider When Using the Risk-Reward Ratio
- Conclusion
- FAQs
Ever bought a share, watched it dip, and wondered if you should have exited sooner? You are not alone. Most beginners ask, “How much can I make?” Experienced traders ask a smarter question first: “How much can I lose?” That is exactly what the risk-reward ratio answers. Let us break it down in plain English, using ₹ examples and real trading idea from Paytm Money.
What Is the Risk-Reward Ratio?
The risk-reward ratio, also called the risk/return ratio, compares what you could lose with what you hope to gain. It tells you whether a trade is worth taking before you commit any money.
- Risk: the amount you lose if the trade goes wrong.
- Reward: the amount you gain if it works.
- Formula: Risk-Reward Ratio = Potential Loss ÷ Potential Gain.
A ratio of 1:2 means ₹1 of risk for every ₹2 of potential reward. A lower ratio indicates that the potential reward is higher relative to the risk, while a higher ratio indicates that the potential reward is lower relative to the risk. However, the ratio alone does not determine whether a trade is suitable, as the probability of reaching the target also matters.
Why the Risk-Reward Ratio Matters
- Some traders consider a 1:3 risk-reward ratio favourable because the potential reward is three times the amount at risk. However, the suitability of a ratio depends on the trading strategy, market conditions and probability of achieving the target.
- The best risk-reward ratio differs from one trading strategy to another, so some trial and error is normal.
- Many investors fix their ratio in advance.
- Stop-loss orders and put options help you keep risk under control.
A Simple Risk-Reward Ratio Example
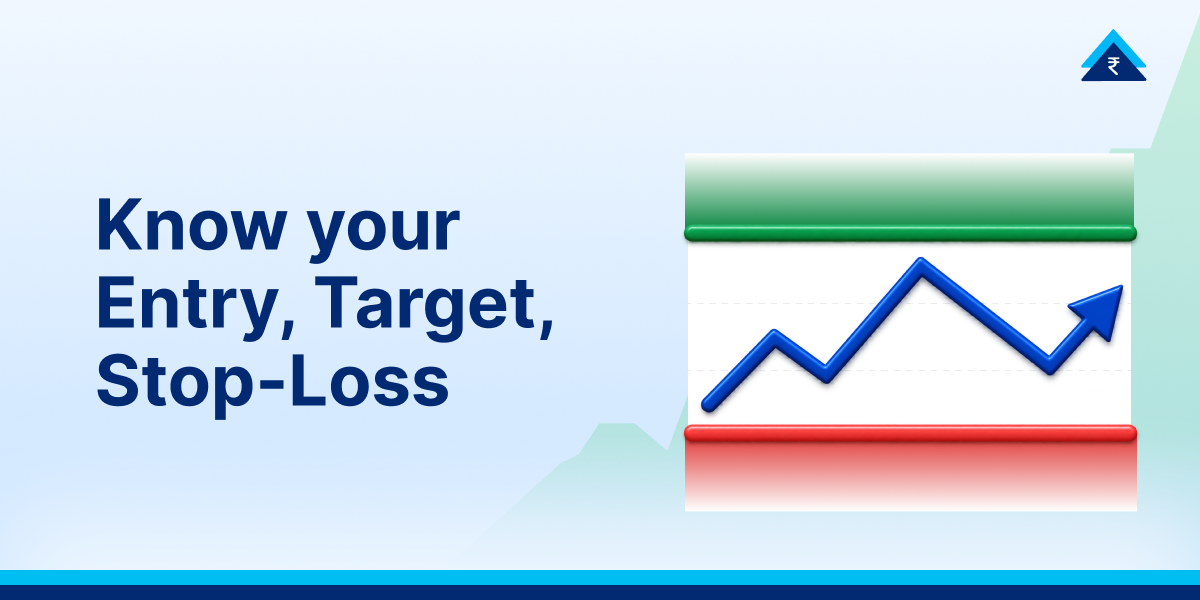
A trader buys 100 shares of XYZ Company at ₹20. She places a stop-loss order at ₹15, which means her estimated loss would be ₹500 if the order executes at that price, excluding applicable charges and slippage. She expects the price to reach ₹30 within a few months.
| Detail | Amount |
|---|---|
| Entry price | ₹20 |
| Stop-loss | ₹15 |
| Target price | ₹30 |
| Risk per share | ₹5 |
| Reward per share | ₹10 |
| Maximum loss | ₹500 |
| Potential gain | ₹1,000 |
| Risk-reward ratio | 1:2 |
Note: XYZ Company and all figures above are hypothetical and used only to explain the concept. They are not a recommendation to buy, sell or hold any security. Stop-loss orders limit risk but do not remove it, and an order may execute at a different price in volatile markets. Investments in securities markets are subject to market risks.
She stands to make double what she risks. A put option, which gives you the right to sell at a set price, can work in a similar way.
What Happens When You Change the Stop-Loss?
Want a 1:5 risk-reward ratio? Move the stop-loss from ₹15 to ₹18 and keep the ₹30 target.
| Detail | Stop-loss at ₹15 | Stop-loss at ₹18 |
|---|---|---|
| Risk per share | ₹5 | ₹2 |
| Reward per share | ₹10 | ₹10 |
| Maximum loss | ₹500 | ₹200 |
| Risk-reward ratio | 1:2 | 1:5 |
| Likelihood of triggering during normal price fluctuations | Relatively lower | Relatively higher |
Note: This comparison is for illustration only and does not reflect any actual trade or prediction of price movement. A higher risk-reward ratio does not mean a higher chance of profit, and past or hypothetical results do not guarantee future returns. Please decide stop-loss and target levels based on your own risk appetite and financial situation.
There is a catch. The tighter stop-loss is closer to the entry price, making it more likely to be triggered by normal price fluctuations. Although this improves the risk-reward ratio, it does not necessarily improve the probability of the trade reaching its target. The outcome also depends on the stock’s volatility and market conditions.
How to Estimate Reward and Risk
Expected reward can be estimated using:
- Price targets: Identifying potential price levels using technical analysis and historical price movements.
- Probability analysis: Assessing the likelihood of different price outcomes based on technical analysis.
Potential loss can be estimated using:
- Technical analysis: Identifying potential support levels and setting stop-loss levels accordingly.
- Historical volatility: Studying past price fluctuations to understand the extent of potential price movements.
Risk-Reward Ratio in Paytm Money Trading Ideas
Each trading idea includes defined entry, target and stop-loss levels, along with an indicative risk-reward ratio based on these parameters.
| Trading idea | Upside potential | Duration | Risk-reward ratio |
|---|---|---|---|
| Intraday Trades | 1% to 2% | Same day | 1:1.5 |
| 11 AM Trade (T+5) | 5% to 10%+ | T+1 to 5 days | 1:2 |
| Alpha and Swing Trades | 5% to 10%+ | 3 to 15 trading days | 1:2 |
| Short-Term Positional Calls | 5% to 15% | 5 to 30 trading days | 1:2.5 |
Note: The upside potential and risk-reward ratios shown are indicative levels set when a trading idea is issued. They are not guarantees of returns. Actual outcomes may differ, and losses can exceed expectations in fast-moving markets. Trading ideas are research views, not personalised advice, so please consider your own financial situation and risk appetite before acting. Investments in securities markets are subject to market risks. Read all related documents carefully before investing.
Intraday example: You buy 100 shares at ₹600 with a 2% target of ₹612. For a 1:1.5 ratio, the stop-loss sits at ₹592. Your risk is ₹800 and your reward is ₹1,200.
Positional example: You buy 50 shares at ₹400 and aim for 10% upside at ₹440. For a 1:2.5 ratio, the stop-loss sits at ₹384. Your risk is ₹800 and your reward is ₹2,000.
Exit Rules to Remember
- Intraday: close within the same session, or convert to a short-term trade with revised parameters.
- Swing: close on target or stop-loss. Otherwise, review after 5 trading sessions. After 5% upside, book profits any time after T+3.
- Short-term positional: review within 15 trading sessions. After 5% upside, book profits any time after T+3.
- 11 AM Trade: review within 5 trading days. After 5% upside, book profits any time after T+1.
Margin Trading Facility (MTF) can boost capital efficiency, but leverage magnifies gains and losses. Strict stop-loss discipline matters even more.
Can the Risk-Reward Ratio Change Over Time?
Yes. As the stock price moves, the potential risk and reward of a trade can change. Suppose you buy a share at ₹20, with a target of ₹30 and a stop-loss of ₹15. If the price rises to ₹26, the remaining potential reward is ₹4 per share, while the potential loss if the price falls to ₹15 is ₹11 per share. This changes the risk-reward ratio from 1:2 to approximately 2.75:1. Therefore, regularly reassess the trade’s risk and reward as market prices change.
Points to Consider When Using the Risk-Reward Ratio
- Set your stop-loss before you buy.
- Match the risk-reward ratio to your own risk tolerance.
- Do not chase a high ratio alone. Check the odds too.
- Review often. As prices move, your risk-reward ratio changes. A rising stock may offer less reward than when you bought it.
Conclusion
The risk-reward ratio will not predict winners. It simply helps you size up each trade with a cool head. Whether you trade for a few hours or a few weeks, a clear ratio keeps emotions out of the decision. Set your entry, target and stop-loss levels before entering a trade, evaluate the potential reward against the risk, and review your positions as market conditions change.
Disclaimer: Investments in the securities market are subject to market risks, read all the related documents carefully before investing. Registration granted by SEBI, enlistment with BSE and certification from NISM in no way guarantee performance of the Research Analyst or provide any assurance of returns to investors. Paytm Money Limited is a distributor for Non-Broking Products/Services such as Mutual Funds and SIP any other third-party products/ services.
All disputes with respect to the distribution activity, would not have access to SCORES/ ODR, Exchange investor redressal forum or Arbitration mechanism. SEBI Reg No. Broking – INZ000240532; Depository Participant – IN – DP – 416 – 2019, Depository Participant Number: CDSL – 12088800. Trading and clearing member of: NSE (90165, M52073), BSE (6707), MCX (57525), NCDEX (1315, M51110), MSEI (85300). SEBI Reg. No. Research Analyst – INH000020086. Regd Office: 136, 1st Floor, Devika Tower, Nehru Place, Delhi – 110019. For complete Terms & Conditions and Disclaimers visit https://www.paytmmoney.com