Introduction
If you’re trading index options—especially during expiry—every second, signal, and setup matters. But until now, accessing live price action, OI shifts, Max Pain levels, and sentiment indicators required jumping across tabs and tools, slowing you down when you need to move fast.
That changes today.
Introducing two new tools on Paytm Money that bring your entire expiry and index trading strategy into one screen:
1. The F&O Index Analysis Widget: Your all-in-one derivatives dashboard
2. Max Pain Visual Tracker: Your expiry compass, now made visual
Together, they remove friction, reduce guesswork, and give you the clarity to trade with conviction—without wasting time toggling.
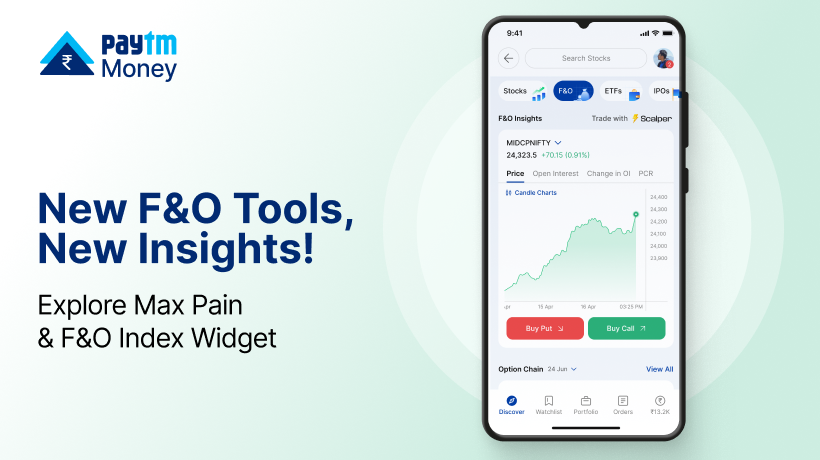
F&O Index Analysis Widget: The Trader’s Dashboard
This widget is your live pulse of the derivatives market, purpose-built for Nifty and Bank Nifty traders. It brings together everything you need to read the market’s mind—at a glance.
What’s inside?
1. Live Intraday Index Chart: Spot sudden moves or reversals with time-based price action.
2. Open Interest + Change in OI: Quickly see where positions are building up—bullish or bearish—and how they’re shifting intraday.
3. Put-Call Ratio (PCR): No need to calculate. It’s visual, real-time, and index-specific.
4. FII/DII Activity: Know what the big players are doing—buying or selling? Long or short?
5. ATM Straddle Chart: Gauge expected move and market range based on implied volatility of near-the-money options.
6. Advance-Decline Ratio: Understand the underlying market strength—are most index stocks rising or falling?
7. Quick Launch to Scalper & Option Chain: Deep dive into trades or plan strategies, instantly.
For example:
You’re watching Bank Nifty and notice a price rise, but OI is falling and PCR is reversing. FII data shows short build-up. That’s a potential short-covering rally, not a breakout—your call strategy just got avoided, saving you a misstep.
Max Pain Chart: Expiry Sentiment, Now Visual
Max Pain is no secret, but it’s been difficult to use. Most traders had to squint at tables and manually guess where the market might settle. We’ve changed that.
Now, Max Pain is visual, dynamic, and trackable.
What you’ll see:
1. Live Line Chart of Max Pain vs. underlying index price
2. Sparklines showing how Max Pain has shifted during the day
3. Tooltips with timestamps—so you can track the trend and potential expiry drift
4. Visual Drift Cues: See if Max Pain is pulling toward or away from the current price, indicating bullish or bearish pressure
5. Integrated View: Access this directly within the Index Widget; no extra screen needed
Lets understand with an example:
It’s Thursday afternoon. NIFTY is at 25,500, but Max Pain has drifted to 25,200 from 25,000 in the past 2 hours. That subtle shift, combined with strong OI at 25,200 puts, suggests expiry could gravitate toward 25,200. You adjust your short straddle accordingly to protect yourself from a last-hour move.
Why This Changes the Game for Expiry & F&O Traders?
1. Speed: No toggling. All expiry-critical data on one screen.
2. Clarity: Visuals > tables. Especially under pressure.
3. Precision: Know the sentiment, read the build-up, time your entry.
4. Control: From ATM range to PCR to Max Pain—everything you need to refine your strike and expiry decisions.
Whether you’re trading index options intraday, holding a strangle across the week, or looking for smart adjustments on expiry day, these tools shrink the noise and sharpen the signal.
Conclusion: Built for the Way You Trade
These aren’t just new features—they’re designed responses to how real traders operate. Fast setups. Cleaner insights. Fewer clicks. Whether you’re a seasoned expiry strategist or just diving into F&O, the F&O Index Widget and Max Pain Tracker give you the kind of control that wasn’t available before.
Ready to level up your expiry game?
Open the app → Head to Indices → Start analyzing smarter and faster.
Disclaimer: Investments in the securities market are subject to market risks, read all the related documents carefully before investing. This content is purely for educational purposes only and in no way to be considered as advice or recommendation. The securities are quoted as an example and not as a recommendation. Paytm Money Ltd SEBI Reg No. Broking – INZ000240532, Depository Participant – IN – DP – 416 – 2019, Depository Participant Number: CDSL – 12088800, NSE (90165), BSE (6707), BSE STAR MF (53873) Regd Office: 136, 1st Floor, Devika Tower, Nehru Place, Delhi – 110019. For complete. Terms & Conditions and Disclaimers visit: https://www.paytmmoney.com/stocks/policies/terms.