For many retail investors, the stock market feels overwhelming, with countless stocks to track. Identifying trading opportunities can be time consuming and exhausting. The Market Radar tool on Paytm Money simplifies this process by scanning the market in real time and highlighting stocks that meet specific technical criteria, helping traders focus on meaningful price movements.
- What is Market Radar?
- Key Features of the Market Radar Tool and Navigation
- 1. Customisable Time Intervals
- 2. Sector and Symbol Filtering
- 3. Dynamic “Choose Events” Filter
- Decoding Bullish vs. Bearish Signals
- The Bullish Tab
- The Bearish Tab
- How to Use Market Radar Effectively
- Where to Find the Market Radar on Paytm Money
- The Benefits of a Visual Radar
- Conclusion
- FAQs
What is Market Radar?
Market Radar is a real time stock discovery tool. It highlights stocks hitting new highs or lows, breaking key levels, or opening with a gap. By grouping signals as bullish or bearish, it quickly shows overall market sentiment.
Key Features of the Market Radar Tool and Navigation
The interface is built for speed and simplicity, ensuring that even a novice trader can find actionable information within seconds.
1. Customisable Time Intervals
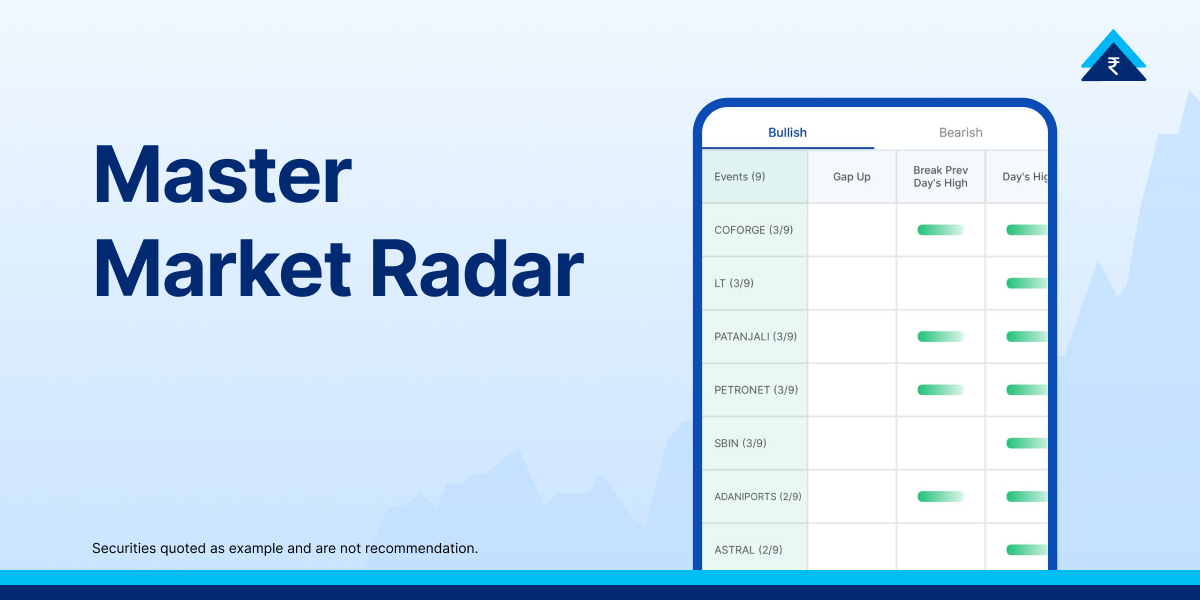
The tool allows you to select specific timeframes to observe market activity. As seen in the provided images, traders can set the interval to the “Last 15 Minutes” to catch intraday momentum as it happens. This flexibility is crucial for day traders who need to react to sudden shifts in price volume.
2. Sector and Symbol Filtering
You do not always want to see the whole market. Market Radar allows you to filter by Sector (e.g., Banking, IT, Auto) or search for a specific Symbol. This helps in identifying whether a stock’s movement is an isolated event or part of a larger sectoral trend.
3. Dynamic “Choose Events” Filter
This is the engine of the tool. Traders can toggle specific technical triggers to narrow down their search. These triggers include:
- Gap Up / Gap Down: This reflects stocks opening significantly higher or lower than their previous close.
- Break Previous Day High / Low: A classic technical signal indicating a potential trend continuation or reversal.
- Day’s High / Low: Identifying stocks that are currently trading at their peak or trough for the session.
Decoding Bullish vs. Bearish Signals
Market Radar separates stocks into two distinct tabs, allowing you to align your strategy with the prevailing market direction.
The Bullish Tab
When the Bullish tab is selected, the tool highlights segments of the market showing strength.
- Event Selection: If you select filters like “Gap up” or “Break Previous Day high”, the tool will reflect the stocks under those specific categories that are showing upward momentum.
- Real-time Strength: Seeing multiple events triggered under the “Day’s high” category suggests strong buying pressure across those particular equities.
The Bearish Tab
Conversely, the Bearish tab identifies areas of the market showing weakness.
- Negative Triggers: By selecting events like “Gap Down” or “Break Previous day low,” the list will reflect the stocks under those filters that are losing value.
- Breaking Lows: When the tool shows a high count of events for “Break Previous day low,” it indicates that sellers are currently in control of those specific assets.
How to Use Market Radar Effectively
To get the most out of Market Radar, it should be used as a starting point for further analysis rather than a direct “buy” or “sell” signal generator. Not all triggered events result in sustained price moves, so traders often validate signals using charts and risk management rules.
- Step 1: Identify the Trend Start by looking at the event counts. If the Bearish tab has significantly more events than the Bullish tab, the overall market sentiment for that time interval is likely weak.
- Step 2: Filter for Quality Use the “Choose Events” checkboxes to find stocks that meet multiple criteria. For example, a stock that has both a “Gap Up” and “Breaks Previous Day High” may indicate stronger momentum compared to a single event trigger..
- Step 3: Sector Confirmation If you see three different banking stocks appearing in the Bearish list simultaneously, it provides a strong hint that the entire Banking sector is facing pressure. This sectoral confirmation adds a layer of safety to your trades.
- Step 4: Execute with Context Once Market Radar gives you a shortlist (e.g., INDUSTOWER or FEDERALBNK), click on the stock to view its full chart, check technical indicators like RSI or MACD, and look at the order book before placing a trade.
Where to Find the Market Radar on Paytm Money
- Launch the application on your mobile device to get started.
- Locate the Futures and Options (F&O) dashboard from the main menu.
- Scroll down to the “Trader Tools” section and select the Market Radar tool.
- Use the search tab to find specific symbols, or filter by Sector and select your preferred Time Interval (e.g., Last 15 Minutes) to catch real-time momentum.
- The tool will automatically reflect the stocks under Bullish or Bearish categories based on the technical “Events” you have selected, such as “Gap Up” or “Break Previous Day Low”.
- Tap on a stock from the generated list to open its detailed chart and technical indicators, allowing you to validate the signal before placing a trade.
The Benefits of a Visual Radar
The primary advantage of the Paytm Money Market Radar is the reduction of cognitive load. In a fast-moving market, “analysis paralysis” is a real threat. By using a clean, list-based format with simple blue tick boxes and clear Bullish/Bearish headings, the tool allows you to:
- Save Time: No more manual scanning of watchlists.
- Stay Objective: The tool relies on hard price data, removing emotional bias from your stock selection.
- Capture Opportunity: It catches “Events” the moment they happen, allowing you to enter trades at the beginning of a move rather than chasing it later.
Conclusion
The Market Radar tool on Paytm Money is an invaluable asset for anyone looking to trade with precision. By transforming complex market data into simple, actionable “Events,” it levels the playing field for retail traders. Whether you are looking for a quick intraday scalp on a stock hitting its Day’s High or searching for a short-term bearish play on a stock Breaking its Previous Day Low, this tool provides the clarity needed to navigate the markets with confidence.
As with all trading tools, remember that Market Radar is a compass, not a crystal ball. Always practice sound risk management and use these insights as part of a broader, well-researched trading plan.
Disclaimer: Investment in the securities market is subject to market risks. Read all the related documents carefully before investing. This content is purely for information purpose only and in no way is to be considered as an advice or recommendation. The securities are quoted as an example and not as a recommendation. Investors are requested to do their own due diligence before investing.
SEBI Reg No.: Broking – INZ000240532, Research Analyst – INH000020086, Depository Participant – IN-DP-416-2019, Depository Participant Number: CDSL – 12088800, NSE (90165), BSE (6707), MCX (57525), NCDEX (1315), MSEI (85300).
Registered Office: 136, 1st Floor, Devika Tower, Nehru Place, Delhi – 110019.
For complete Terms & Conditions and Disclaimers, visit https://www.paytmmoney.com.