Investing isn’t just about picking a stock and hoping for the best—it’s about making informed, data-backed decisions. And at Paytm Money, we understand that behind every confident trade is a story, a signal, a data point, or a trend that validates it.
- Stock Price & Movement—Right Where You Need It
- Quick Order Actions for Swift Moves
- Tabs Tailored to Every Type of Investor
- Overview Tab – Your First Checkpoint
- F&O – Top Contracts & Option Chain in One Place
- Technicals – For Chartists & Traders
- Fundamentals – The Core Company Picture
- News – Sorted, Filtered & Focused
- Events – Stay in Sync with the Company Calendar
- One-Tap Buy/Sell – Trade When You’re Ready
To empower your investing journey, we’re excited to introduce our newly revamped Company Page—your one-stop, scrollable dashboard for everything you need to know about a stock.
From live prices and expert insights to technical signals and fundamental metrics—this update is designed to bring clarity, speed, and depth to your decision-making process. Whether you’re a beginner or an advanced trader, this is your 360° Stock Snapshot.
Stock Price & Movement—Right Where You Need It
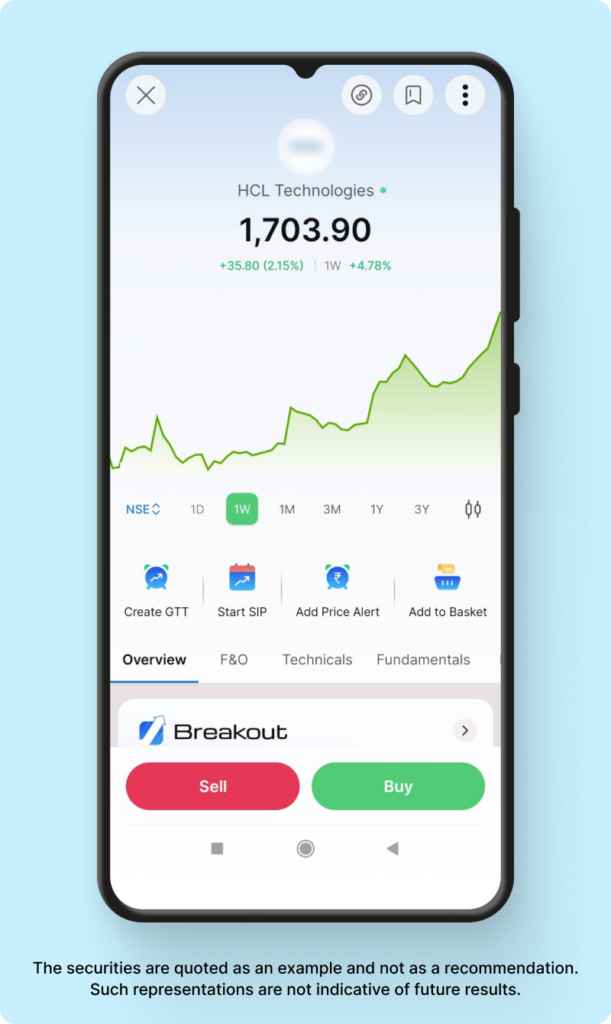

No more app-switching or chart hopping. At the top of the Company Page, you’ll see:
– Live Stock Price along with the day’s change in both absolute points and percentage
– Price Trends across multiple timeframes: 1 Day, 1 Week, 1 Month, 3 Months, 6 Months, 1 Year, and 3 Years
Want to toggle between NSE and BSE?
Just tap the exchange name. Prefer candlestick charts? Tap the icon next to the 3Y view.
For active traders, quick actions like opening the Option Chain, Add to Watchlist and Pinning the Stock to Your Dashboard, are available at the top.
Quick Order Actions for Swift Moves
Below the stock chart, you’ll find a Quick Order Bar that lets you:
– Place a Good Till Triggered (GTT) order
– Start a Stock SIP
– Add Price Alerts
– Add to your Basket Trades
All without having to exit the page or search for the stock again.
Tabs Tailored to Every Type of Investor
We know investors are diverse—long-term holders, technical traders, options specialists, or news-driven decision makers. That’s why the Company Page comes with dedicated tabs to serve every style:
1. Overview – Actionable summary with breakout signals, market depth & more
2. F&O – Top options, open interest and volume data, Option Chain
3. Technicals – Charting tools and technical indicators like MACD, RSI, EMA
4. Fundamentals – Key financial data, shareholding patterns & company info
5. News – All the latest updates relevant to your stock
6. Events – Earnings, dividends, bonuses & key company milestones
Overview Tab – Your First Checkpoint
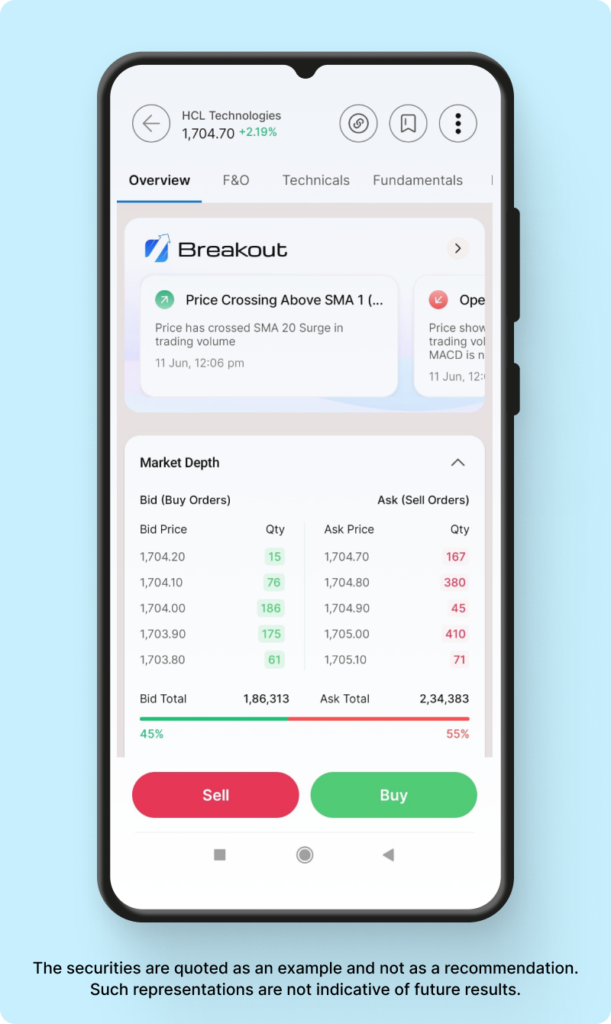

The Overview tab summarizes essential stock data with a focus on:
– Breakout Alerts: Spot breakout levels or strong technical moves
– Market Depth: View top 5 Buy/Sell orders, volume, and average price
– OHLC & Circuits: Daily open-high-low-close data and 52-week ranges
– Expert Ratings: Powered by Refinitiv
– Nifty50 Comparison: How the stock is performing vs benchmark index
– Similar Companies: Find peers in the same sector or industry
– Price Alerts: Set them instantly, from -10% to +10% or custom levels
F&O – Top Contracts & Option Chain in One Place

If you’re into Derivatives Trading, this tab is built for you.
It includes:
– Top Options: Sorted by Highest Volume, Highest OI, and At-The-Money
– Full Option Chain for the nearest expiry, with expandable views
– Easy access to price movement and contract details
Technicals – For Chartists & Traders
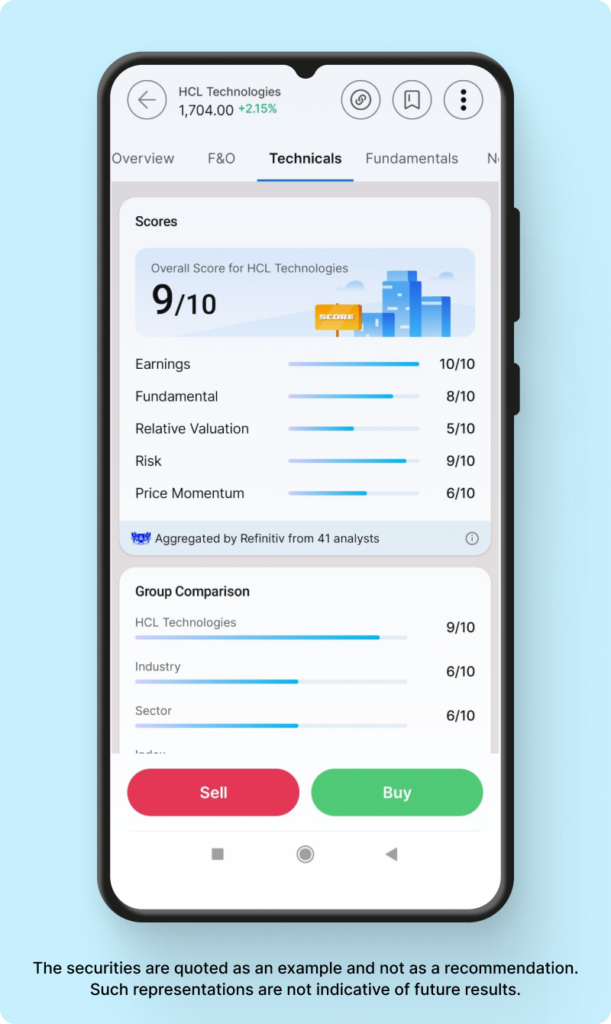

If you rely on charts, indicators, and momentum signals, this section is for you.
You get:
– Refinitiv Score based on metrics like earnings, risk, and valuation
– Pivot Points – Switch between Classic and Fibonacci styles
– Moving Averages – View EMA for 10, 20, and 50 days
– MACD – Analyze momentum shifts using MACD (12, 26, 9) and MACD (12, 26)
– Price Averages – Compare price trends over short/medium terms
You can even see how your selected stock stacks up against industry, sector, and market-cap peers.
Fundamentals – The Core Company Picture
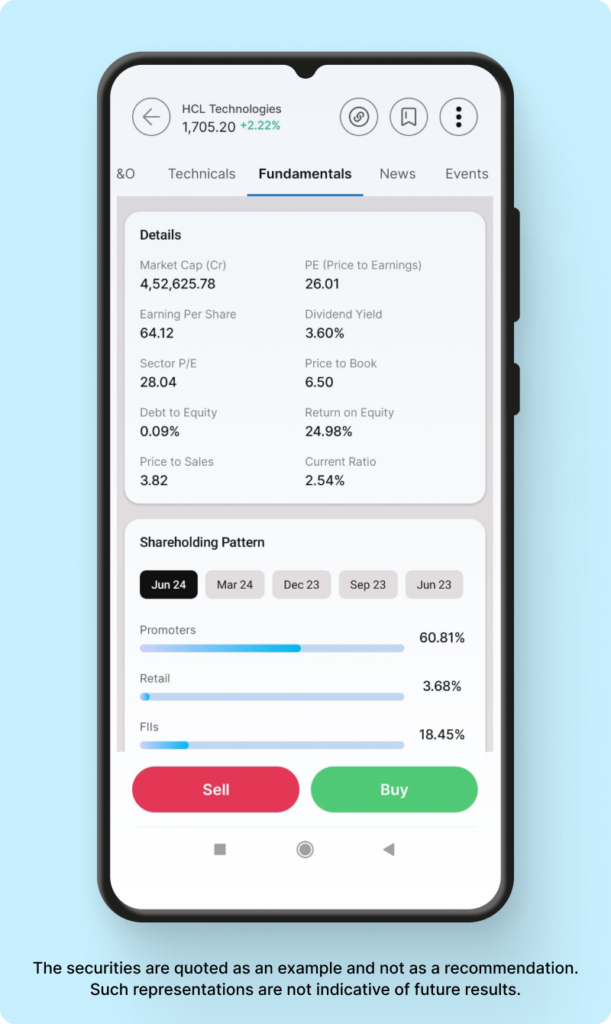

Want to understand what a company stands for and how stable it is?
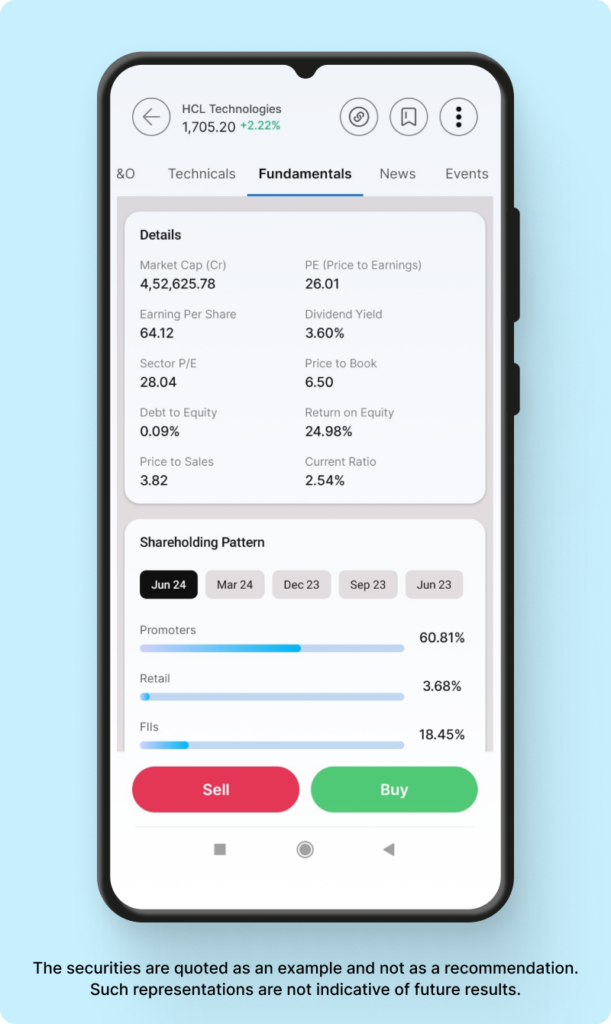
The Fundamentals tab shows:
– Market Cap, PE ratio, EPS and other valuation metrics
– Shareholding Breakdown over quarters: Promoters, FIIs, DIIs, Retail
– Company Profile, including industry, sector, and cap classification
– Direct link to a detailed Company Research Article for deeper insights
News – Sorted, Filtered & Focused
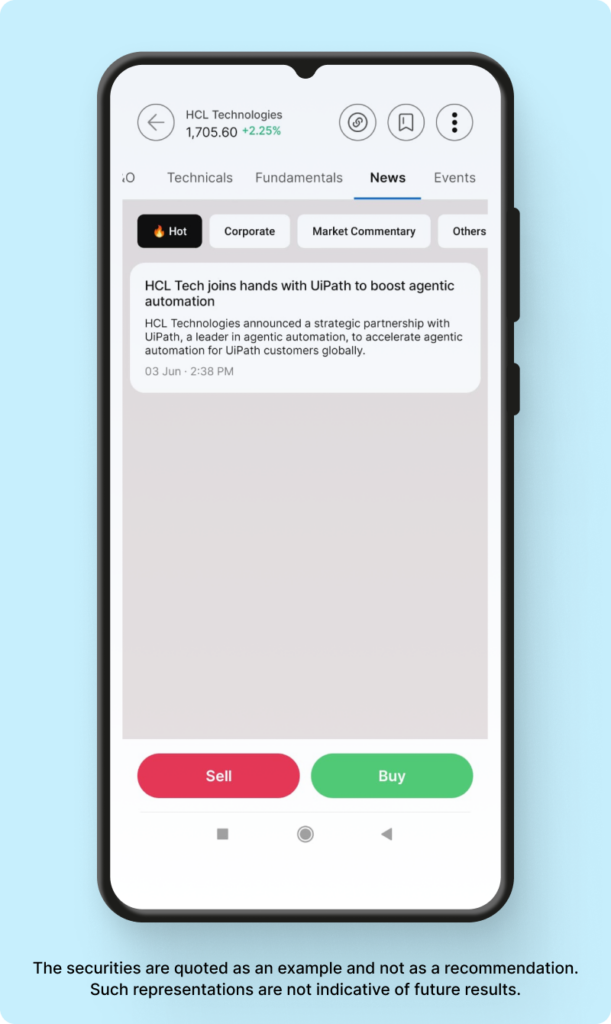

Cut through the noise and focus on only what’s relevant.
The News tab is sorted for the stock you’re viewing, across:
– Hot Updates
– Corporate News
– Market Commentary
– Other Developments
Events – Stay in Sync with the Company Calendar
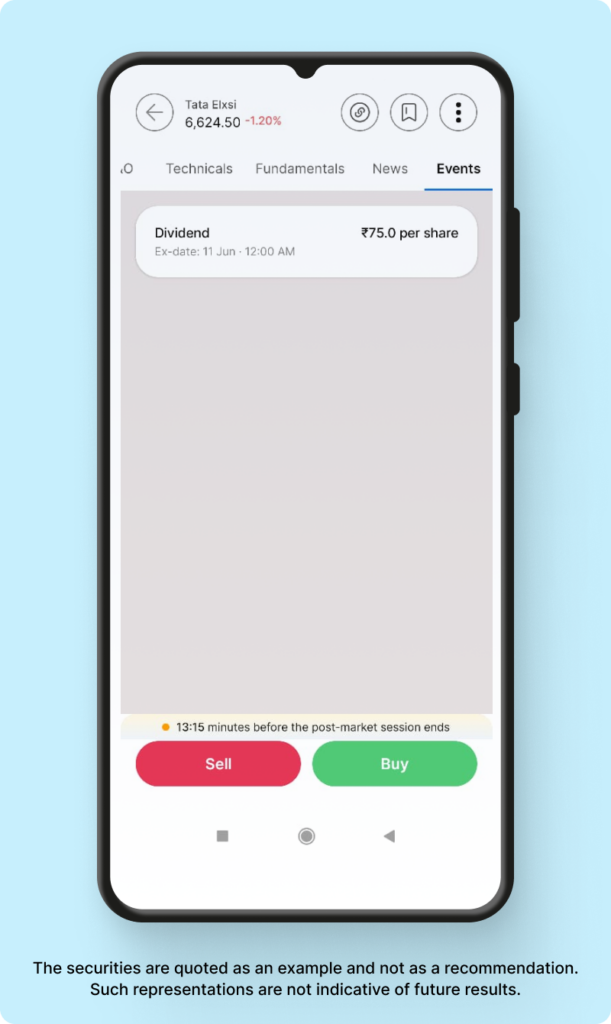

Never miss a market-moving event again.
In the Events tab, you’ll find:
– Earnings Dates
– Dividend Declarations
– Bonus/Split Announcements
– Other Key Timelines
One-Tap Buy/Sell – Trade When You’re Ready
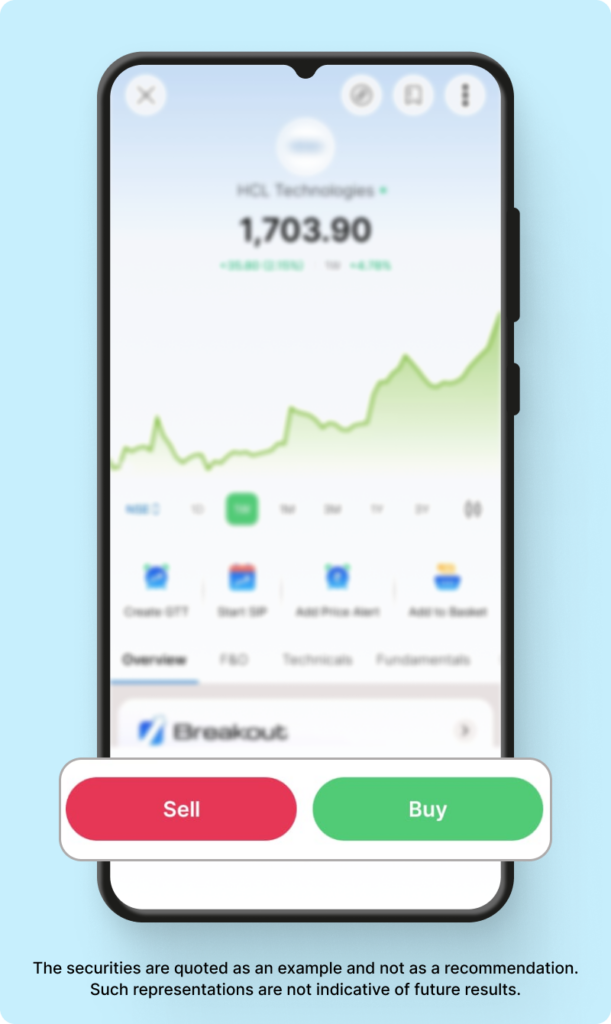

Once you’ve explored the data and made your decision, the Buy and Sell buttons are right there—no scrolling or second-guessing.
This seamless action flow means less time spent executing and more time focused on your strategy.
Whether you’re doing a quick check before placing a trade or diving into deep research, the Company Page keeps it clean, fast, and focused.
The next time you tap a stock on Paytm Money, you’ll see the difference. No clutter. No confusion. Just insights that matter.
As always, we’d love to hear your feedback at feedback@paytmmoney.com.
Disclaimer: Investments in the securities market are subject to market risks, read all the related documents carefully before investing. This content is purely for educational purposes only and in no way to be considered as advice or recommendation. The securities are quoted as an example and not as a recommendation. Paytm Money Ltd SEBI Reg No. Broking – INZ000240532, Depository Participant – IN – DP – 416 – 2019, Depository Participant Number: CDSL – 12088800, NSE (90165), BSE (6707), BSE STAR MF (53873) Regd Office: 136, 1st Floor, Devika Tower, Nehru Place, Delhi – 110019. For complete. Terms & Conditions and Disclaimers visit: https://www.paytmmoney.com/stocks/policies/terms.


