The stock market, a complex and dynamic entity, is often likened to a vast ocean. Its movements, influenced by many factors, can seem unpredictable and chaotic. However, beneath the surface lies a structure of trends and patterns that offer valuable insights to investors willing to learn their language. Understanding these trends is crucial for making informed investment decisions, minimising risk, and maximising potential returns. This blog post delves into the various trends shaping the stock market, providing a comprehensive guide for investors of all levels.
- Defining Trends: The Foundation of Market Analysis
- The Three Primary Trend Classifications:
- 1. Uptrend (Bull Market):
- 2. Downtrend (Bear Market):
- 3. Sideways Trend (Consolidation/Range-Bound Market):
- Time Horizons: Classifying Trends by Duration
- 1. Long-Term Trends (Primary Trends):
- 2. Intermediate-Term Trends (Secondary Trends):
- 3. Short-Term Trends (Minor Trends):
- Technical Analysis and Trend Identification:
- 1. Trendlines:
- 2. Moving Averages:
- 3. Chart Patterns:
- 4. Volume Analysis:
- 5. Relative Strength Index (RSI):
- 6. Moving Average Convergence Divergence (MACD):
- Factors Influencing Market Trends:
- 1. Economic Factors:
- 2. Political Factors:
- 3. Company Fundamentals:
- 4. Investor Sentiment:
- 5. Global Events:
- The Importance of Trend Following:
- Conclusion: Mastering the Tides
- General Trend Questions:
- Trend Duration Questions:
- Technical Analysis Questions:
- Factors Influencing Trends Questions:
- Trend Following Questions:
Defining Trends: The Foundation of Market Analysis
At its core, a trend represents the general direction in which a market or asset moves over a specific period. It’s not about the daily fluctuations but rather the overarching trajectory that reveals the market’s sentiment and momentum. Trends are not static; they evolve, shift, and sometimes reverse, demanding constant vigilance and adaptability from investors.
The Three Primary Trend Classifications:
The most fundamental classification of market trends involves three primary categories:
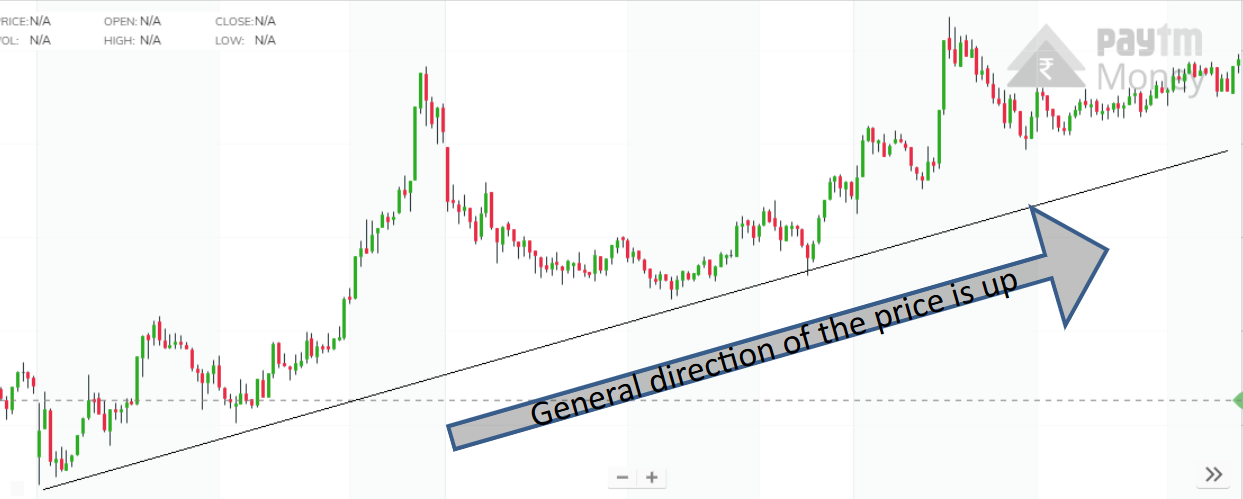
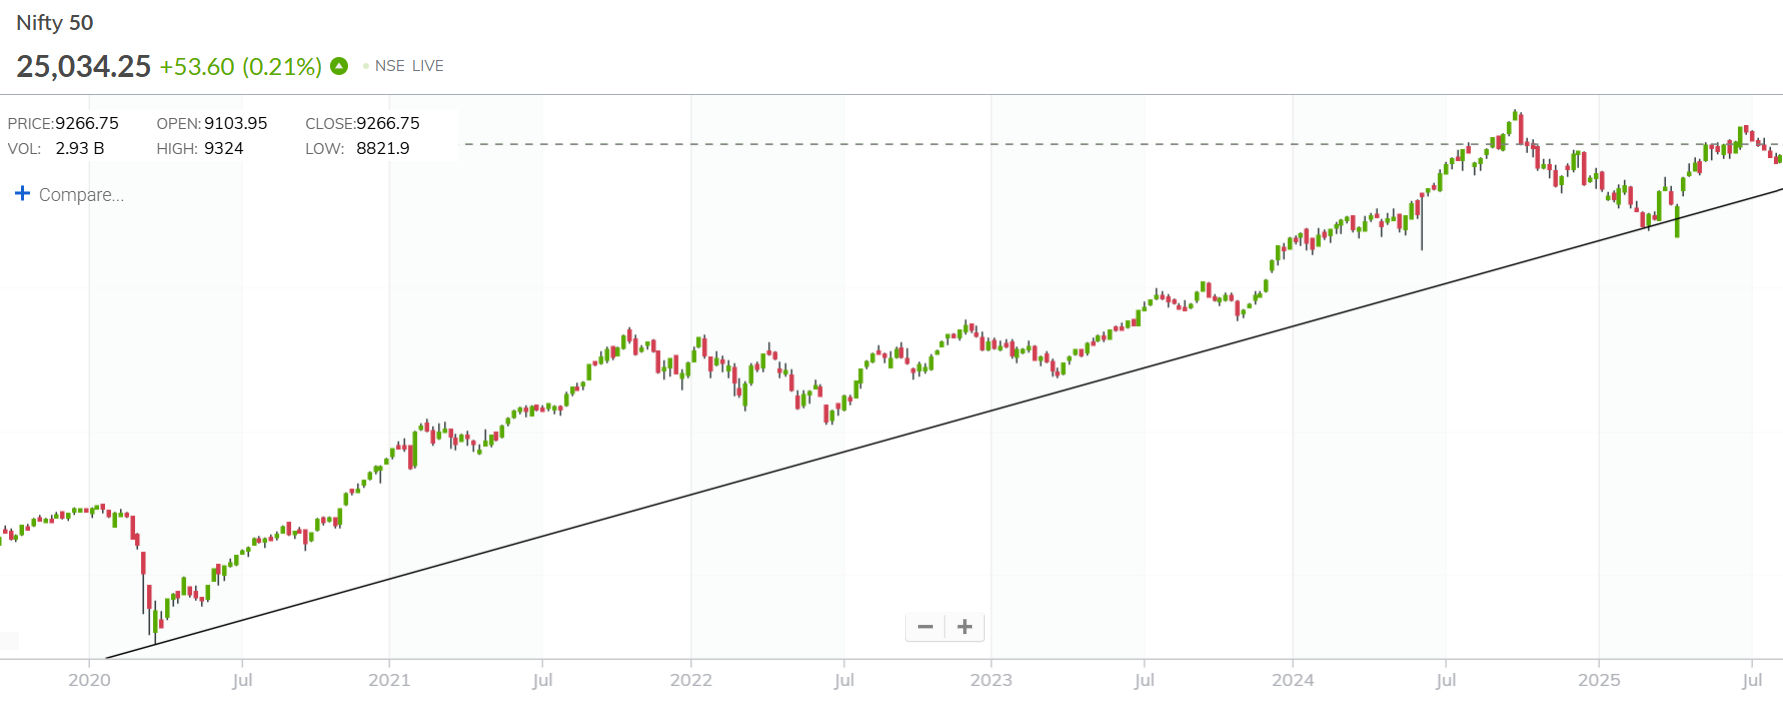
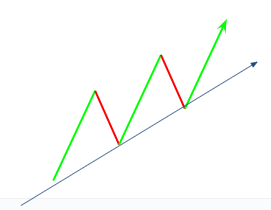
1. Uptrend (Bull Market):
- An uptrend, a bull market, is characterised by higher and lower highs. This indicates a period of sustained price increases, reflecting optimism and confidence among investors.
- Characteristics:
- Rising prices across a broad range of stocks.
- Increased trading volume during price rallies.
- Positive economic indicators, such as low unemployment and increasing GDP.
- Investor sentiment is generally bullish.
- Duration: Uptrends can last months or years, offering significant growth opportunities.
- Trading Strategy: “Buy the dips” is a common strategy in which investors purchase stocks during temporary price declines within the overall uptrend.
- Example: A long-term bull market could be seen after the 2008 financial crisis, lasting until the beginning of 2020.
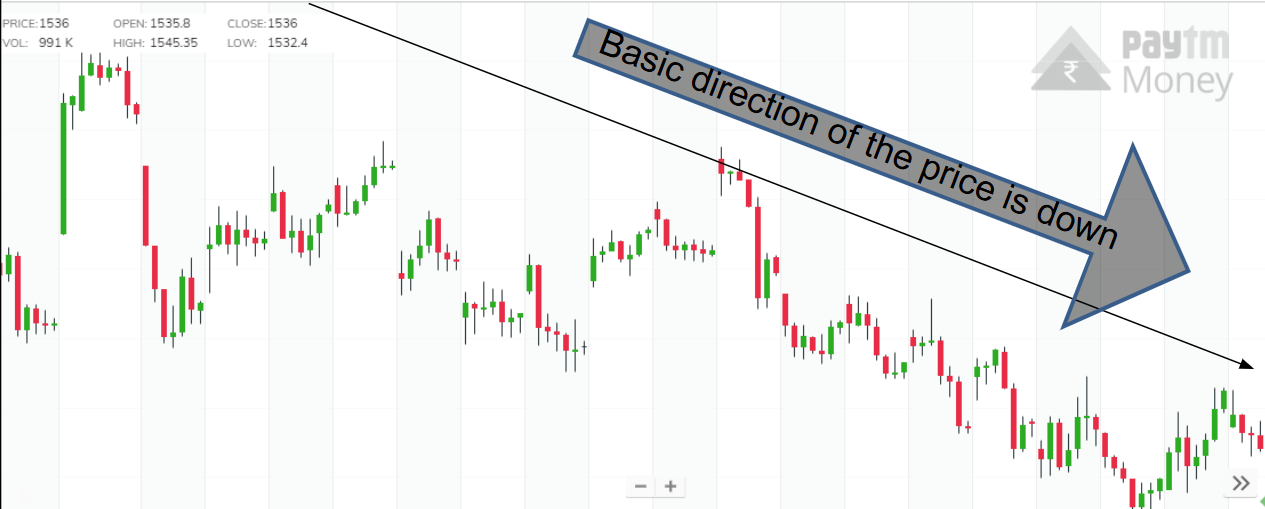
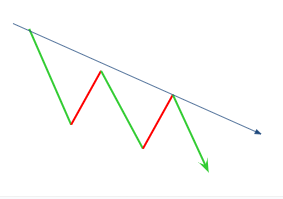
2. Downtrend (Bear Market):
- A downtrend, or bear market, is defined by a series of lower highs and lower lows. This signifies a period of declining prices, reflecting pessimism and fear.
- Characteristics:
- Falling prices across a broad range of stocks.
- Increased trading volume during price declines.
- Negative economic indicators, such as rising unemployment and declining GDP.
- Investor sentiment is generally bearish.
- Duration: Downtrends can also last months or years, leading to significant losses if not managed properly.
- Trading Strategy: “Short selling” or staying in cash are common strategies during a downtrend.
- Example: The financial crisis of 2008 triggered a severe bear market.
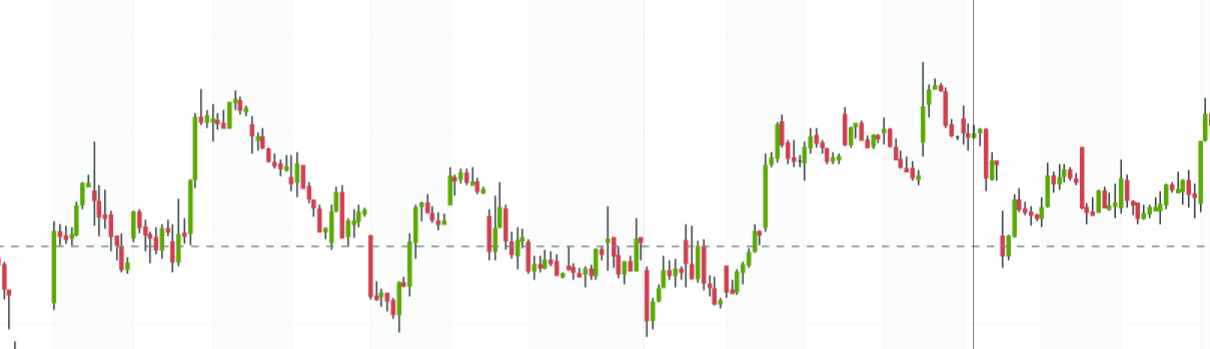
3. Sideways Trend (Consolidation/Range-Bound Market):
- A sideways trend, or a consolidation or range-bound market, occurs when prices fluctuate within a relatively narrow range without a clear upward or downward direction.
- Characteristics:
- Prices oscillate between support and resistance levels.
- Trading volume is often lower and more erratic.
- Market sentiment is indecisive.
- Duration: Sideways trends can last for varying periods, often preceding a breakout or breakdown.
- Trading Strategy: Range trading, involving buying at support and selling at resistance, is a common strategy.
- Example: A stock that stays between $50 and $60 for several months is moving sideways.
Time Horizons: Classifying Trends by Duration
Beyond the primary trend directions, trends can also be categorised by their duration:
1. Long-Term Trends (Primary Trends):
- These trends span several months or years, reflecting the overall direction of the market or a specific asset.
- Fundamental factors, such as economic conditions, interest rates, and geopolitical events influence them.
- Long-term trends are the most significant for long-term investors.
2. Intermediate-Term Trends (Secondary Trends):
- These trends last several weeks or months, representing corrections or reactions within a long-term trend.
- They are influenced by factors such as earnings reports, news events, and investor sentiment.
- Intermediate-term trends are essential for swing traders and medium-term investors.
3. Short-Term Trends (Minor Trends):
- These trends last days or weeks, representing minor fluctuations within an intermediate-term trend.
- They are influenced by factors such as daily news, technical indicators, and short-term trading activity.
- Short-term trends are primarily relevant for day traders and scalpers.
Technical Analysis and Trend Identification:
Technical analysis plays a crucial role in identifying and analysing market trends. Several tools and techniques are used:
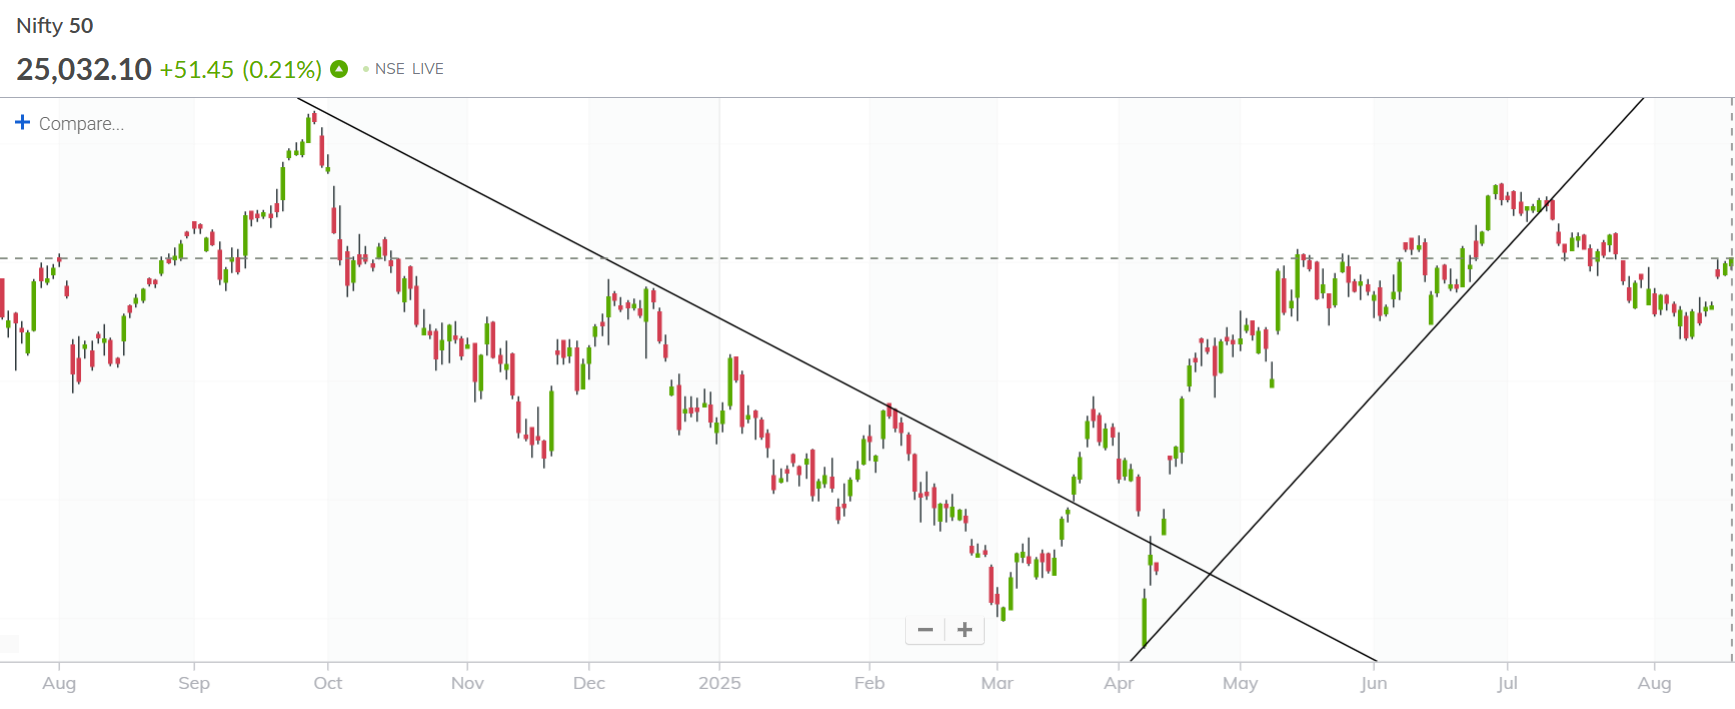
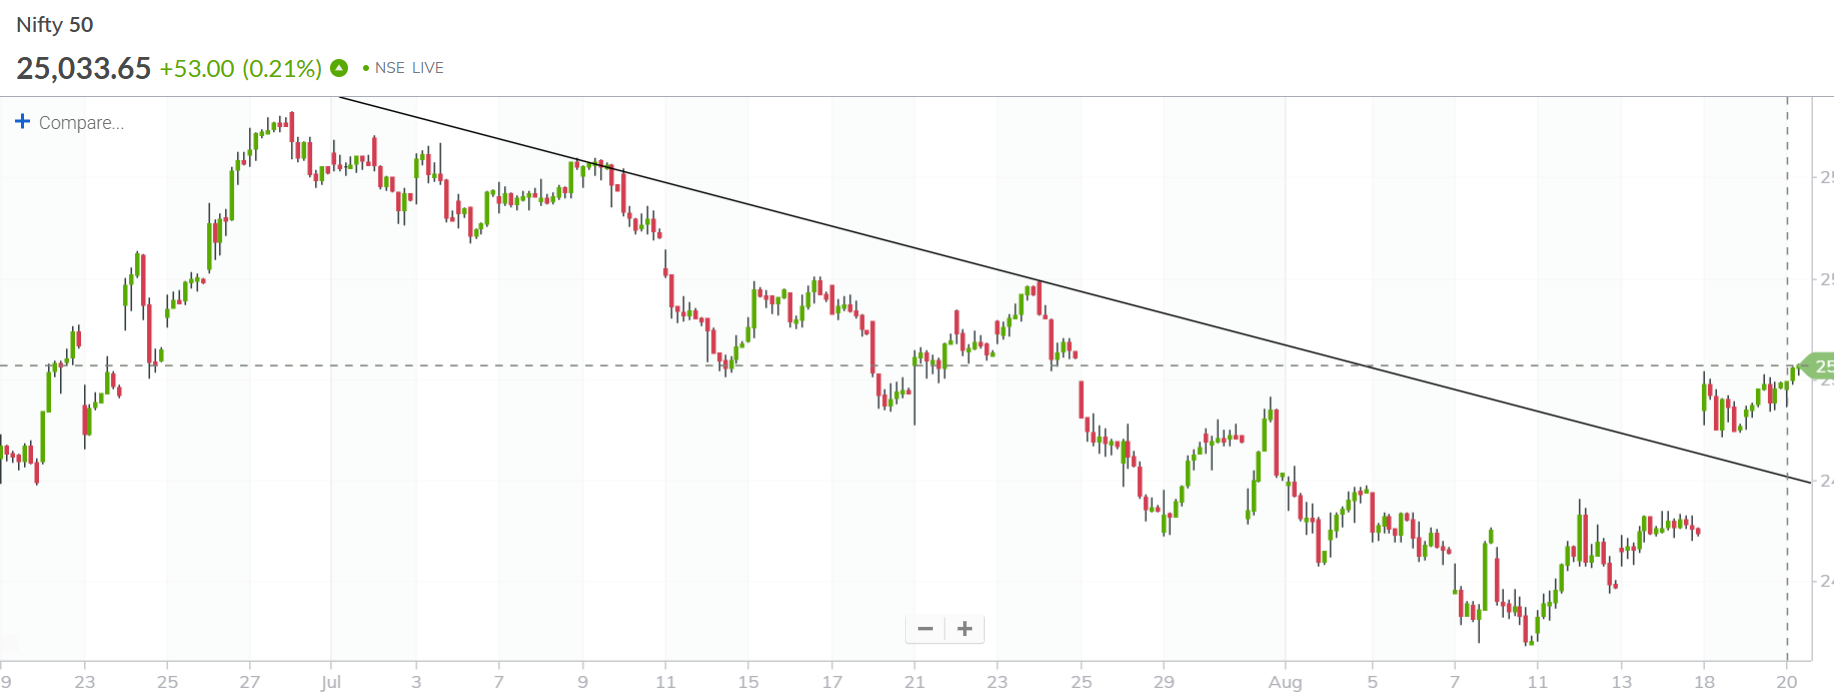
1. Trendlines:
- Trendlines are lines drawn on a chart connecting a series of highs or lows to visualise the direction of a trend.
- An upward-sloping trendline indicates an uptrend, while a downward-sloping trendline indicates a downtrend.
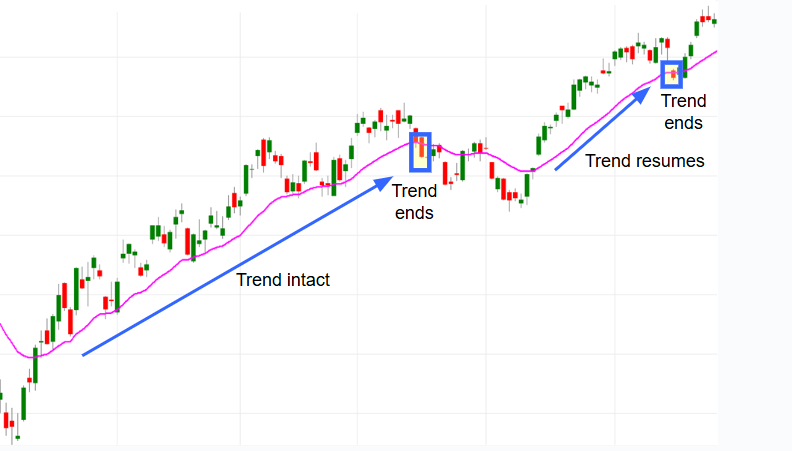
2. Moving Averages:
- Moving averages smooth out price fluctuations, highlighting the underlying trend.
- Standard moving averages include the 50-day, 100-day, and 200-day moving averages.
- When prices are above a moving average, it suggests an uptrend; when prices are below, it indicates a downtrend.
3. Chart Patterns:
- Chart patterns, such as head and shoulders, double tops, and triangles, can indicate potential trend reversals or continuations.
- Recognising these patterns can provide valuable trading signals.
4. Volume Analysis:
- Volume analysis helps confirm the strength of a trend.
- Rising volume during an uptrend suggests strong buying pressure while rising volume during a downtrend suggests strong selling pressure.
5. Relative Strength Index (RSI):
- The RSI is a momentum indicator that measures the speed and change of price movements.
- It helps identify overbought or oversold conditions, which can signal potential trend reversals.
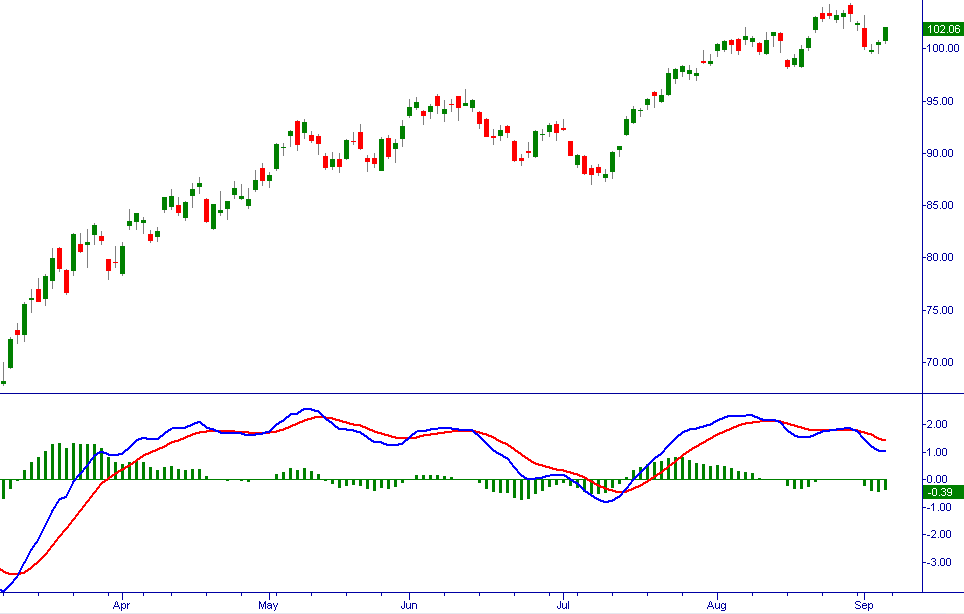
6. Moving Average Convergence Divergence (MACD):
- The MACD is a trend-following momentum indicator that shows the relationship between two moving averages of a security’s price.
- It can be used to identify changes in the strength, direction, momentum, and duration of a trend in a security’s price.
Factors Influencing Market Trends:
A complex interplay of factors influences market trends:
1. Economic Factors:
GDP growth, inflation, interest rates, and employment data can significantly impact market trends.
2. Political Factors:
Government policies, political stability, and geopolitical events can create volatility and influence market sentiment.
3. Company Fundamentals:
Earnings reports, revenue growth, and management decisions can affect individual stock trends.
4. Investor Sentiment:
Investor psychology, fear, and greed can drive short-term and intermediate-term trends.
5. Global Events:
Global events like pandemics, wars, and international trade agreements can impact the stock market.
The Importance of Trend Following:
Trend following is a trading strategy that involves identifying and capitalising on established trends. It’s based on the principle that trends tend to persist, and by following them, investors can increase their chances of success.
Benefits of Trend Following:
- Reduces emotional decision-making.
- Allows for capturing significant price movements.
- Provides a disciplined approach to trading.
Risks of Trend Following:
- Whipsaws, where the market changes direction quickly, can cause losses.
- Trends do not last forever, and a trend reversal can be costly.
- Requires discipline and patience.
Conclusion: Mastering the Tides
Understanding the various trends in the stock market is essential for successful investing. Investors can make more informed decisions by recognising uptrends, downtrends, and sideways trends and analysing them across different time horizons.
Technical analysis tools and techniques provide valuable insights into trend identification and confirmation. However, it’s crucial to remember that the market is dynamic and unpredictable.
No strategy guarantees success and risk management is paramount. By combining trend analysis with sound investment principles, investors can navigate the stock market’s tides and achieve their financial goals.
General Trend Questions:
Q: What is a trend in the stock market?
A: A trend represents the general direction in which a market or asset moves over a specific period. It’s the overarching trajectory, not the daily fluctuations.
Q: Why is it essential to understand stock market trends?
A: Understanding trends helps investors make informed decisions, minimise risk, and maximise potential returns by identifying periods of growth or decline.
Q: What are the three primary types of trends?
A: The three primary trends are: * Uptrend (Bull Market) * Downtrend (Bear Market) * Sideways Trend (Consolidation/Range-Bound Market)
Q: How do I distinguish between an uptrend and a downtrend?
A: An uptrend features a series of higher highs and higher lows, while a downtrend features a series of lower and lower lows.
Q: What is a sideways trend, and how does it differ from uptrends and downtrends?
A: A sideways trend is when prices fluctuate within a narrow range without a clear upward or downward direction. It differs from uptrends and downtrends, which show a distinct directional movement.
Trend Duration Questions:
Q: What are long-term trends?
A: Long-term trends (primary trends) span several months or years and reflect the overall market direction. Fundamental factors like economic conditions influence them.
Q: What are intermediate-term trends?
A: Intermediate-term trends (secondary trends) last for several weeks or months and represent corrections or reactions within a long-term trend.
Q: What are short-term trends?
A: Short-term trends (minor trends) last for days or weeks and represent minor fluctuations within an intermediate-term trend.
Q: How do the different time horizons affect trading strategies?
A: Long-term trends are crucial for long-term investors, intermediate-term trends are relevant for swing traders, and short-term trends are primarily for day traders and scalpers.
Technical Analysis Questions:
Q: What is technical analysis, and how does it help identify trends?
A: Technical analysis uses charts and indicators to identify and analyse market trends, providing insights into potential price movements.
Q: What are trendlines, and how are they used?
A: Trendlines are lines drawn on charts connecting a series of highs or lows to visualise the direction of a trend.
Q: What are moving averages, and how do they help identify trends?
A: Moving averages smooth out price fluctuations, highlighting the underlying trend by averaging prices over a specific period.
Q: What are chart patterns, and how do they indicate trends?
A: Chart patterns, like head and shoulders or triangles, can indicate potential trend reversals or continuations.
Q: How does volume analysis help confirm a trend?
A: Volume analysis confirms the strength of a trend. Rising volume during an uptrend suggests strong buying pressure, and rising volume during a downtrend suggests strong selling pressure.
Q: What is the RSI (Relative Strength Index)?
A: The RSI is a momentum indicator that measures the speed and change of price movements, helping identify overbought or oversold conditions.
Q: What is the MACD (Moving Average Convergence Divergence)?
A: The MACD is a trend-following momentum indicator that shows the relationship between two moving averages of a security’s price and can be used to identify changes in the strength, direction, momentum, and duration of a trend.
Factors Influencing Trends Questions:
Q: What economic factors influence market trends?
A: Economic factors like GDP growth, inflation, interest rates, and employment data significantly impact market trends.
Q: How do political factors affect the stock market?
A: Government policies, political stability, and geopolitical events can create volatility and influence market sentiment.
Q: How do company fundamentals influence stock trends?
A: Earnings reports, revenue growth, and management decisions can affect individual stock trends.
Q: How does investor sentiment impact market trends?
A: Investor psychology, fear, and greed can drive short-term and intermediate-term trends.
Q: How do global events affect the stock market?
A: Global events like pandemics, wars, and international trade agreements can impact the stock market.
Trend Following Questions:
Q: What is trend following?
A: Trend following is a trading strategy that involves identifying and capitalising on established trends.
Q: What are the benefits of trend following?
A: Benefits include reduced emotional decision-making, capturing significant price movements, and a disciplined trading approach.
Q: What are the risks of trend following?
A: Risks include whipsaws, trend reversals, and the need for discipline and patience.
Trading Strategy Questions:
Q: What is “buy the dips”, and when is it used?
A: “Buy the dips” is a strategy where investors purchase stocks during temporary price declines within an uptrend.
Q: What is “short selling” and when is it used?
A: “Short selling” is a strategy in which investors borrow and sell shares, hoping to repurchase them at a lower price. It is used during downtrends.
Q: What is range trading?
A: Range trading involves buying at support levels and selling at resistance levels during a sideways trend.
Risk Management Questions:
Q: Is any trend-following strategy guaranteed to make money?
A: No strategy guarantees success. The market is dynamic and unpredictable.
Q: Why is risk management critical when trading trends?
A: Risk management is crucial to minimise potential losses and protect capital, as trends can reverse unexpectedly.
Disclaimer: Investments in the securities market are subject to market risks, read all the related documents carefully before investing. This content is purely for educational purposes only and in no way to be considered as advice or recommendation. The securities are quoted as an example and not as a recommendation. Paytm Money Ltd SEBI Reg No. Broking – INZ000240532, Depository Participant – IN – DP – 416 – 2019, Depository Participant Number: CDSL – 12088800, NSE (90165), BSE (6707), Regd Office: 136, 1st Floor, Devika Tower, Nehru Place, Delhi – 110019. For complete. Terms & Conditions and Disclaimers visit: https://www.paytmmoney.com/stocks/policies/terms.