For anyone trading derivatives, understanding the option chain is essential. It is one of the most widely used tools by options traders to analyse market positioning, liquidity, and strike-level activity.
- What Is an Option Chain?
- Understanding Option Chain Data
- 1: Strike Price
- 2: Open Interest (OI)
- 3: Change in OI
- 4: Volume
- 5: Implied Volatility (IV)
- How Traders Use Option Chain Analysis
- Identifying Support & Resistance
- Tracking Build-up
- Expiry Positioning
- Strategy Planning
- From Option Chain to Charts: Why Integration Matters
- Common Mistakes in Option Chain Analysis
- Why Option Chain Data Matters in Volatile Markets
- Analyse Option Chains with Clarity
In this guide, we explain the option chain meaning, how to read option chain data, and how traders use option chain analysis to make more structured trading decisions.
What Is an Option Chain?
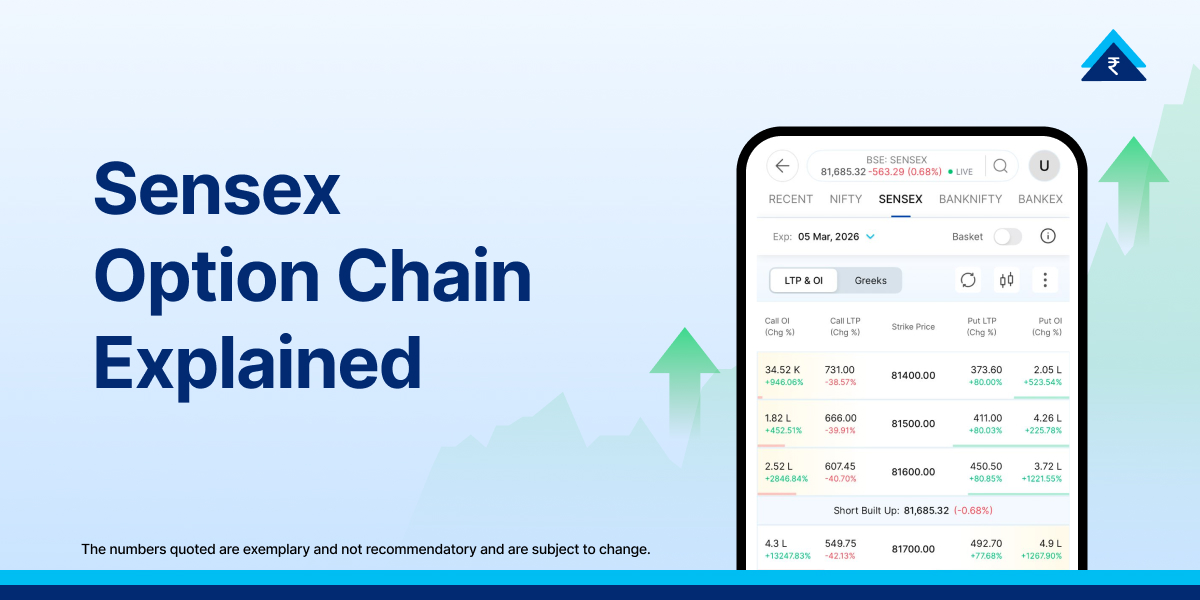
An option chain is a structured table that lists all available call and put option contracts for a particular underlying asset, whether it’s a stock or an index.
The option chain displays key details such as:
- Strike prices
- Call (CE) and Put (PE) premiums
- Open Interest (OI)
- Change in OI
- Volume
- Bid and ask prices
- Implied volatility
In simple terms, the option chain meaning refers to a complete snapshot of how traders are positioned across different strike prices for a specific expiry.
Understanding Option Chain Data
Reading option chain data involves understanding how different columns interact with each other.
1: Strike Price
The price at which the option can be exercised. Strikes are arranged above and below the current market price.
2: Open Interest (OI)
Represents the total number of outstanding contracts. High OI at a strike often indicates strong participation.
3: Change in OI
Shows whether positions are being added or reduced during the session.
4: Volume
Indicates how actively a particular contract is being traded.
5: Implied Volatility (IV)
Reflects expected price fluctuation and directly impacts option premiums.
All these elements together form the basis of option chain analysis.
On Paytm Money, traders can view structured option chain data alongside real-time charts. This helps interpret open interest shifts, volume spikes, and implied volatility changes without switching between multiple tools, especially useful during active trading sessions.
How Traders Use Option Chain Analysis
Traders use the option chain in multiple ways depending on their strategy and time horizon.
Identifying Support & Resistance
- High Put OI → Potential support
- High Call OI → Potential resistance
Tracking Build-up
Increasing OI with price rise may indicate long build-up.
Increasing OI with price fall may indicate short build-up.
Expiry Positioning
Before expiry, traders monitor OI concentration to anticipate potential price movement.
Strategy Planning
Option spreads, straddles, strangles, and hedges are often constructed after reviewing option chain data.
However, analysing structured data alone is not enough. Execution clarity matters just as much.
For traders analysing these patterns, the ability to immediately validate signals using real-time price charts becomes important. On Paytm Money, option chain data integrates with Market Depth & Advanced Charts, allowing traders to confirm whether OI levels align with price action and liquidity conditions.
From Option Chain to Charts: Why Integration Matters
While the option chain meaning provides structured positioning insights, traders often combine it with price charts to validate signals.
For example:
- A strike with high Call OI may act as resistance.
- A breakout above that level on the chart may indicate short covering.
This is where integrated tools become useful.
Market Depth & Advanced Charts on Paytm Money allow traders to view real-time demand and supply along with price action. Instead of switching between multiple platforms, traders can:
- Track liquidity through Market Depth
- Apply technical indicators
- Draw support and resistance levels
- Monitor real-time price updates
By combining option chain analysis with chart-based validation, traders can make more informed entry and exit decisions.
Common Mistakes in Option Chain Analysis
While the option chain is powerful, traders should avoid:
- Relying only on highest OI without trend confirmation
- Ignoring volume shifts
- Misinterpreting short covering
- Overtrading based on minor OI changes
Effective use of the option chain requires combining structured data with disciplined risk management.
Why Option Chain Data Matters in Volatile Markets
In fast-moving markets, premiums change rapidly. Traders who monitor option chain data alongside market depth can better assess:
- Liquidity gaps
- Slippage risk
- Strike-level participation
- Sudden volatility spikes
Having access to both structured option chain data and advanced charting tools reduces decision delays.
Analyse Option Chains with Clarity
Understanding the option chain meaning, interpreting option chain data correctly, and applying structured option chain analysis can significantly improve decision-making in derivatives trading.
When paired with real-time charts and liquidity visibility, traders can move from analysis to execution more efficiently.
Analyse option chains on Paytm Money and access structured data along with advanced charting tools to support your derivatives strategies.
Disclaimer: Investments in securities market are subject to market risks, read all the related documents carefully before investing.. This content is purely for information purpose only and in no way is to be considered as an advice or recommendation. The securities are quoted as an example and not as a recommendation. Investors are requested to do their own due diligence before investing.
SEBI Reg No.: Broking – INZ000240532, Research Analyst – INH000020086, Depository Participant – IN-DP-416-2019, Depository Participant Number: CDSL – 12088800, NSE (90165), BSE (6707), MCX (57525), NCDEX (1315), MSEI (85300).
Registered Office: 136, 1st Floor, Devika Tower, Nehru Place, Delhi – 110019.
For complete Terms & Conditions and Disclaimers, visit https://www.paytmmoney.com.