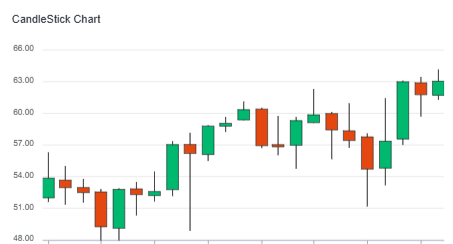
Candlestick charts are powerful visual language in stock market analysis, offering traders and investors a nuanced understanding of price action and market sentiment.
Unlike simple line charts that merely connect closing prices, candlesticks provide a comprehensive picture of the trading range within a specific period, revealing the interplay between buyers and sellers.
This blog post delves into the intricacies of candlestick patterns, exploring their construction, interpretation, and significance in navigating the dynamic stock market landscape.
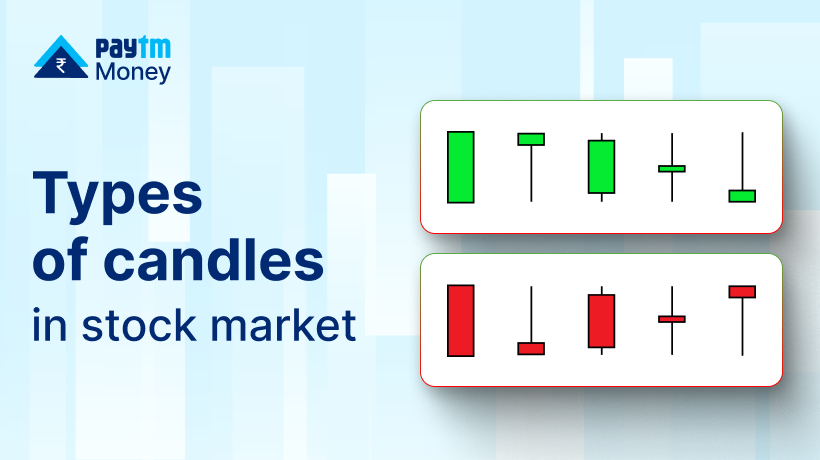
The Anatomy of a Candlestick:
Each candlestick represents the price movement of a security over a specific time frame, such as a day, a week, or an hour. It comprises three key components:
1. The Body: The rectangular portion of the candlestick represents the range between the opening and closing prices.
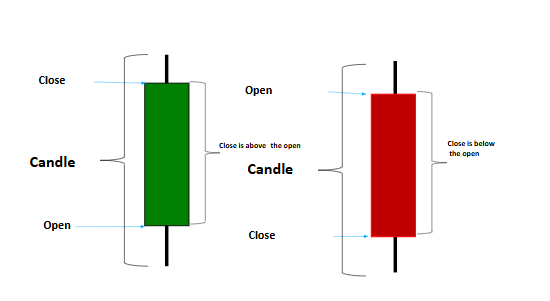
A filled (typically red) body indicates that the closing price was lower than the opening price, signifying a bearish session. A hollow (generally green or white) body means that the closing price was higher than the opening price, indicating a bullish session.
2. The Upper Shadow (or Wick): The thin line extending upward from the body, representing the highest price reached during the period.
3. The Lower Shadow (or Wick): The thin line extending downward from the body, representing the lowest price reached during the period.
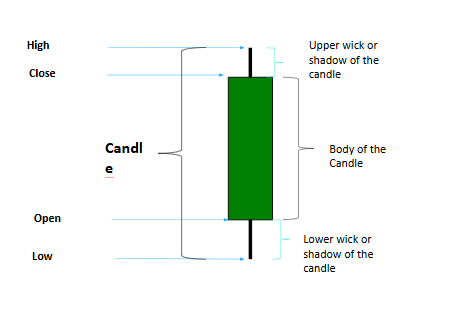
The length of the body and the shadows provide valuable insights into the strength of buying or selling pressure and the volatility of the security.
Decoding Candlestick Patterns:
Candlestick patterns are formed by the interplay of multiple candlesticks. They reveal potential shifts in market sentiment and future price movements. These patterns can be broadly categorised into bullish reversal patterns, bearish reversal patterns, and continuation patterns.
Bullish Reversal Patterns:
These patterns indicate a potential shift from a downtrend to an uptrend, suggesting that buying pressure is gaining momentum.
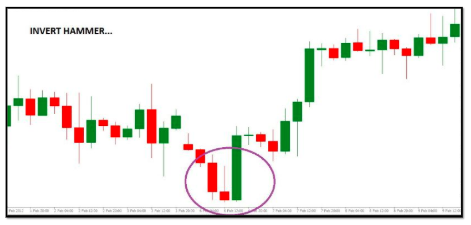
1. Hammer: A candlestick with a small body, a long lower shadow, and little or no upper shadow, indicating that sellers initially pushed the price lower, but buyers stepped in to drive it back up.
 2. Inverted Hammer: Similar to the hammer but with a long upper shadow and little or no lower shadow, suggesting that buyers attempted to push the price higher, but sellers pushed it back down, indicating potential buying pressure.
3. Bullish Engulfing: A pattern where a small bearish candlestick is followed by a more significant bullish candlestick that completely engulfs the previous candlestick, signalling a strong downtrend reversal.
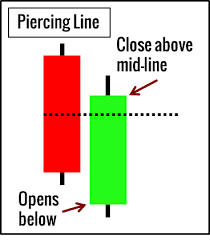
4. Piercing Pattern: A pattern where a bearish candlestick is followed by a bullish candlestick that opens below the previous close and closes above the midpoint of the last candlestick’s body, indicating a potential shift in momentum.
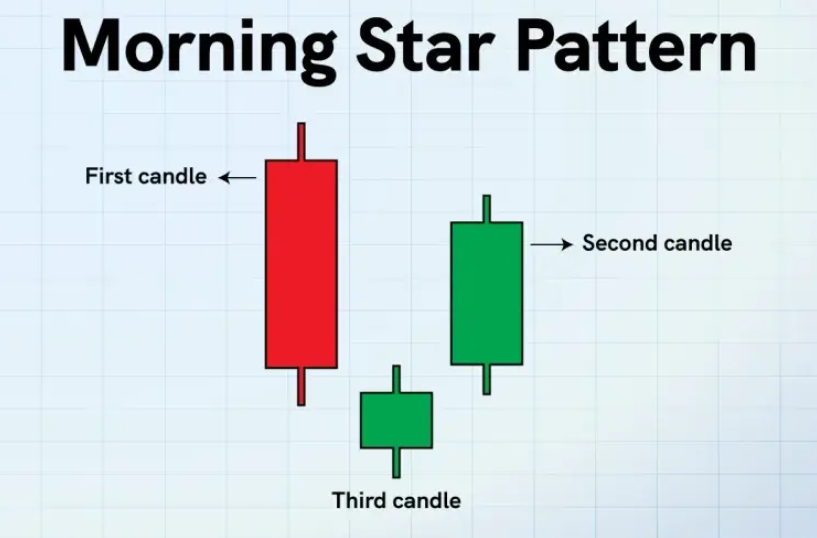
5. Morning Star: A three-candlestick pattern comprising a bearish candlestick, a small-bodied candlestick (doji or spinning top), and a bullish candlestick, signalling a potential bottom reversal.
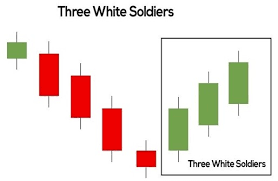
6. Three White Soldiers: A pattern of three consecutive bullish candlesticks, each with a higher close than the previous one, indicating a strong uptrend.
Bearish Reversal Patterns:
These patterns indicate a potential shift from an uptrend to a downtrend, suggesting that selling pressure is gaining momentum.
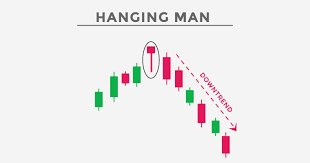
1. Hanging Man: A candlestick with a small body, a long lower shadow, and little or no upper shadow, occurring after an uptrend, indicating potential selling pressure.
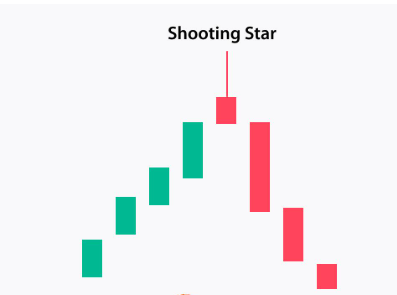
2. Shooting Star: A candlestick with a small body, a long upper shadow, and little or no lower shadow, occurring after an uptrend, indicating potential selling pressure.
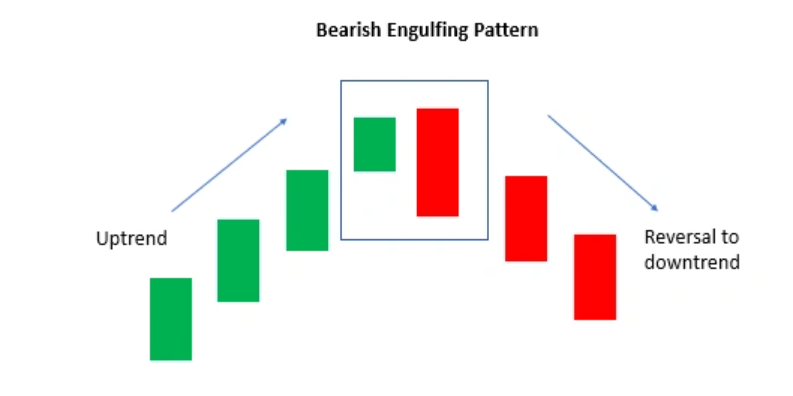
3. Bearish Engulfing: A pattern where a small bullish candlestick is followed by a larger bearish candlestick that completely engulfs the previous candlestick,2 signalling a strong reversal of the uptrend.
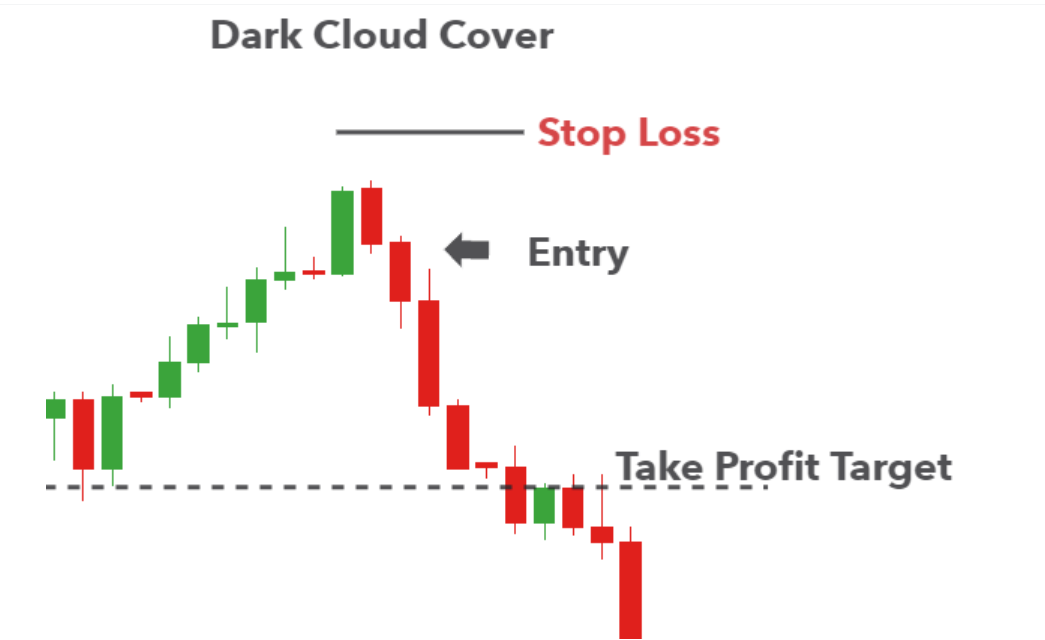
4. Dark Cloud Cover: A pattern where a bullish candlestick is followed by a bearish candlestick that opens above the previous close and closes below the midpoint of the last candlestick’s body, indicating a potential shift in momentum.
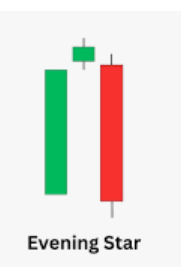
5. Evening Star: A three-candlestick pattern comprising a bullish candlestick, a small-bodied candlestick (doji or spinning top), and a bearish candlestick, signalling a potential top reversal.
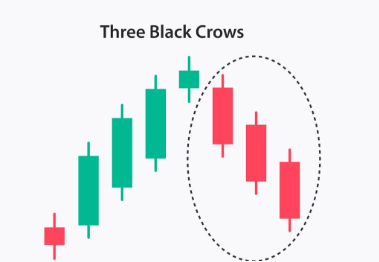
6. Three Black Crows: A pattern of three consecutive bearish candlesticks, each with a lower close than the previous one, indicating a strong downtrend.
Continuation Patterns:
These patterns indicate that the existing trend is likely to continue.
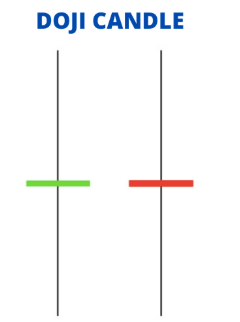
1. Doji: A candlestick with a minor or non-existent body, indicating indecision in the market. Doji patterns can occur in both uptrends and downtrends.
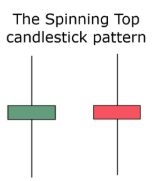
2. Spinning Top: A candlestick with a small body and upper and lower shadows indicates indecision and potential volatility.
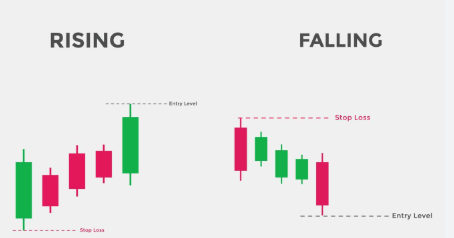
3. Rising Three Methods: A bullish continuation pattern where a series of small bearish candlesticks are contained within the range of a larger bullish candlestick, followed by another bullish candlestick.
4. Falling Three Methods: A bearish continuation pattern where a series of small bullish candlesticks are contained within the range of a larger bearish candlestick, followed by another bearish candlestick.
The Significance of Volume:
Volume plays a crucial role in confirming the validity of candlestick patterns. High volume during a pattern’s formation strengthens its significance, while low volume may indicate a weaker signal.
Combining Candlestick Patterns with Other Indicators:
Candlestick patterns are often used with other technical indicators, such as moving averages, relative strength index (RSI), and MACD, to analyse market conditions comprehensively.
Practical Applications:
Traders and investors widely use candlestick patterns for:
1. Identifying potential entry and exit points: By recognising bullish and bearish reversal patterns, traders can identify potential buy and sell signals.
2. Confirming trend reversals: Candlestick patterns can help to confirm potential trend reversals identified by other technical indicators.
3. Analysing market sentiment: The size and shape of candlesticks and the patterns they form can provide insights into the prevailing market sentiment.
4. Setting stop-loss orders: Candlestick patterns can help to identify potential support and resistance levels, which can be used to set stop-loss orders.
Limitations:
While candlestick patterns can be a valuable tool for market analysis, it’s essential to acknowledge their limitations:
1. Subjectivity: Interpreting candlestick patterns can be subjective, and different traders may draw different conclusions from the same pattern.
2. False Signals: Candlestick patterns can generate false signals, especially in volatile markets.
3. Context is Key: The significance of a candlestick pattern depends on the context in which it occurs. It’s crucial to consider the overall market trend and other technical indicators.
Conclusion:
Candlestick patterns provide a powerful visual representation of market sentiment and price action, offering traders and investors valuable insights into potential future price movements.
By understanding the construction and interpretation of these patterns and combining them with other technical indicators, traders can enhance their analytical skills and improve their trading decisions.
However, it’s crucial to remember that candlestick patterns are not foolproof predictors of the market, and they should be used in conjunction with other forms of analysis and risk management strategies. Continuous learning and practice are essential for mastering the art of candlestick analysis.
General Candlestick Questions:
Q: What are candlestick charts?
A: Candlestick charts are a visual representation of price movements over a specific period, showing the open, high, low, and close prices.
Q: How do candlesticks differ from line charts?
A: Line charts only connect closing prices, while candlesticks provide a more detailed view of price action, including the open, high, low, and close.
Q: What does the “body” of a candlestick represent?
A: The body represents the range between the opening and closing prices. A filled body indicates a bearish session, and a hollow body indicates a bullish session.
Q: What are “shadows” or “wicks” on a candlestick?
A: Shadows represent the highest and lowest prices reached during the period. The upper shadow shows the high, and the lower shadow shows the low.
Q: Are candlestick patterns reliable predictors of future price movements?
A: Candlestick patterns provide insights into potential price movements but are not foolproof predictors. They should be used in conjunction with other forms of analysis.
Candlestick Patterns:
Q: What are bullish reversal patterns?
A: Bullish reversal patterns indicate a potential shift from a downtrend to an uptrend. Examples include the hammer, bullish engulfing, and morning star.
Q: What are bearish reversal patterns?
A: Bearish reversal patterns indicate a potential shift from an uptrend to a downtrend. Examples include the hanging man, bearish engulfing, and evening star.
Q: What are continuation patterns?
A: Continuation patterns suggest that the existing trend is likely to continue. Examples include doji and spinning tops.
Q: What is a “hammer” candlestick?
A: A hammer has a small body, a long lower shadow, and little or no upper shadow, indicating potential buying pressure in a downtrend.
Q: What is a “shooting star” candlestick?
A: A shooting star has a small body, a long upper shadow, and little or no lower shadow, indicating potential selling pressure in an uptrend.
Q: What is a “doji” candlestick?
A: A doji has a small or non-existent body, indicating indecision in the market.
Using Candlestick Patterns:
Q: How do I identify potential entry and exit points using candlestick patterns?
A: By recognising bullish and bearish reversal patterns, traders can identify potential buy and sell signals.
Q: How does volume affect the significance of candlestick patterns?
A: High volume during the formation of a pattern strengthens its significance, while low volume may indicate a weaker signal.
Q: Should I use candlestick patterns alone or with other indicators?
A: For a more comprehensive analysis, candlestick patterns should be used in conjunction with other technical indicators, such as moving averages or RSI.
Q: Can candlestick patterns be used for all timeframes?
A: Yes, candlestick patterns can be used for various timeframes, from short-term (e.g., intraday) to long-term (e.g., weekly or monthly).
Q: How do I learn to recognise candlestick patterns?
A: Learning to recognise candlestick patterns requires study and practice. Many resources, including books and online tutorials, can help.
Limitations:
Q: Are candlestick patterns consistently accurate?
A: Candlestick patterns can generate false signals, and their interpretation can be subjective.
Q: Is it enough to only use Candlestick patterns to trade?
A: No, it is not enough. You should use multiple forms of analysis to confirm signals.
Disclaimer: Investments in the securities market are subject to market risks, read all the related documents carefully before investing. This content is purely for educational purposes only and in no way to be considered as advice or recommendation. The securities are quoted as an example and not as a recommendation. Paytm Money Ltd SEBI Reg No. Broking – INZ000240532, Depository Participant – IN – DP – 416 – 2019, Depository Participant Number: CDSL – 12088800, NSE (90165), BSE (6707), Regd Office: 136, 1st Floor, Devika Tower, Nehru Place, Delhi – 110019. For complete. Terms & Conditions and Disclaimers visit: https://www.paytmmoney.com/stocks/policies/terms.