The Indian mutual fund industry has quietly transformed into one of the most powerful engines of wealth creation in the country. If you have been watching the markets, you may have noticed how more people are moving from traditional savings to market-linked investments. But what truly stands out is the scale of growth.
- Indian Mutual Fund Industry at a Glance
- A Decade of Explosive Growth
- Milestones That Define the Journey
- Rising Investor Participation
- SIP Boom Driving Consistent Growth
- Indian Mutual Fund Growth: AUM & Investor Base (2021–2026)
- Category-wise AUM Growth
- Key Insights:
- Rise of Passive and Commodity Funds
- Industry Expansion and Structural Strength
- Direct vs Distributor Channels
- Paytm Money’s Expanding Role
- Key Performance Highlights
- Strength Indicators
- What is Driving This Growth?
- Conclusion
- FAQs
From just over ₹12 trillion a decade ago to more than ₹82 lakh crore today, along with a surge in investor participation to over 27.06 crore mutual fund accounts, the journey has been nothing short of remarkable. Alongside this surge, digital platforms like Paytm Money have played a key role in making investing simpler, faster, and more accessible.
Let us break down this growth story in a simple and structured way.
Indian Mutual Fund Industry at a Glance
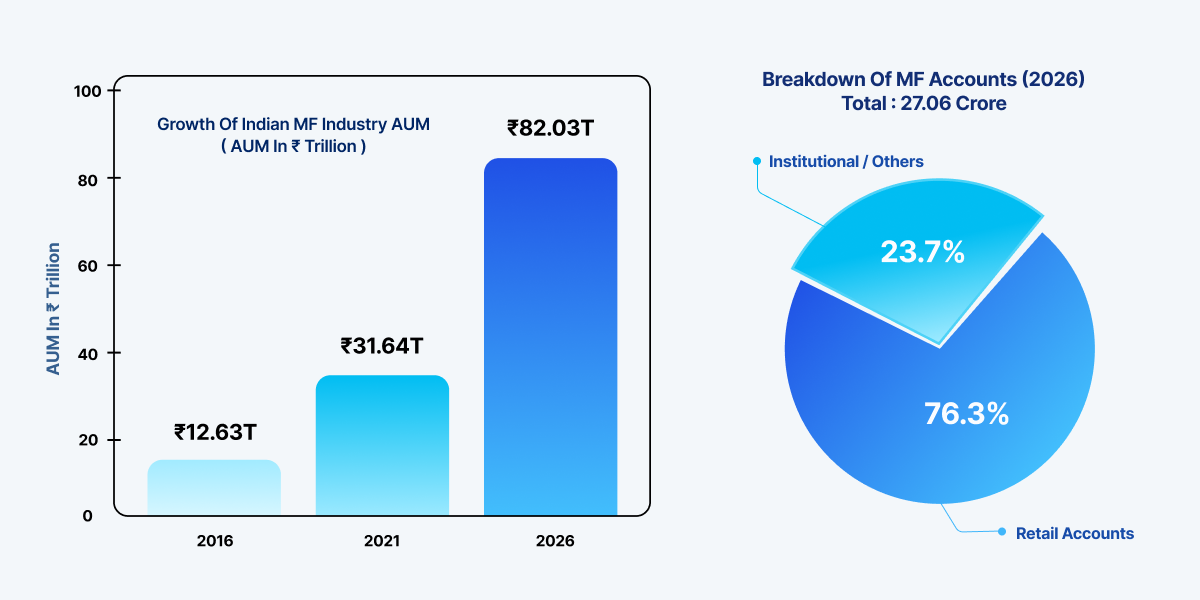
The numbers clearly show that the Indian mutual fund industry growth story is driven by both scale and participation.
(Source: AMFI)
| Assets Under Management (AUM) Assets Under Management (AUM) is the total value of money that a mutual fund manages on behalf of investors. It includes all investments like stocks and bonds, and shows the overall size and popularity of the fund. |
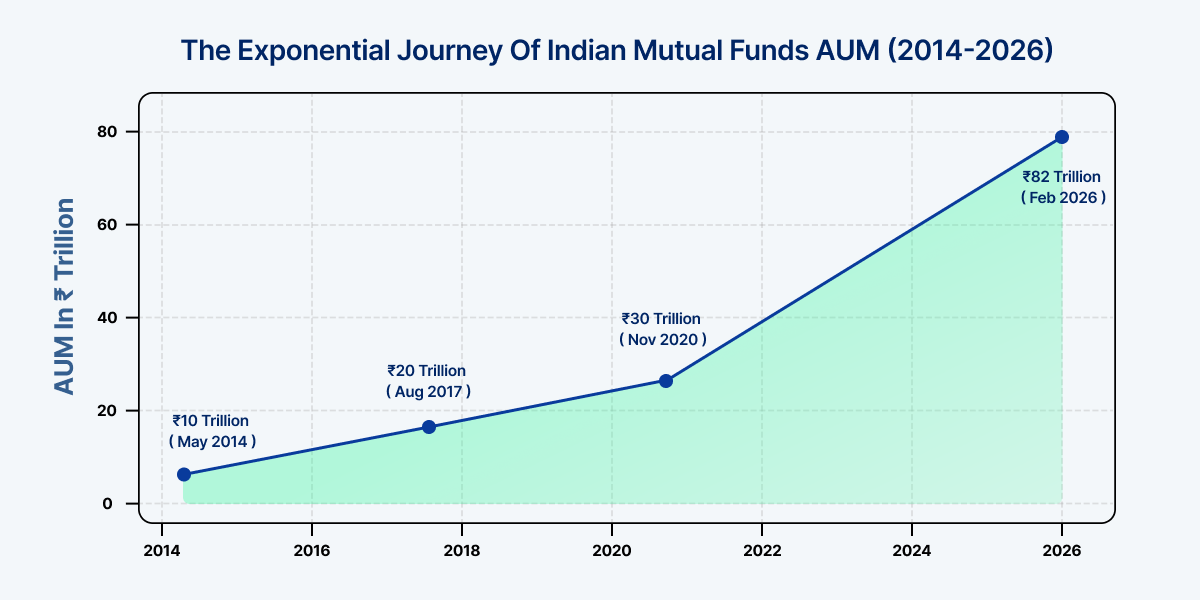
A Decade of Explosive Growth
The industry has grown more than six times in the last 10 years.
- From ₹12.63 trillion in February 2016
- To ₹82.03 trillion in February 2026
That is not all. Even in the last five years alone:
- AUM increased from ₹31.64 trillion (2021)
- To ₹82.03 trillion (2026)
This represents nearly a threefold increase in just five years, highlighting the accelerating pace of adoption. This kind of long-term growth is exactly what disciplined SIP investing aims to capture, especially when planned using simple online SIP calculators.
(Source: AMFI)
Milestones That Define the Journey
The speed at which each milestone was achieved shows growing investor confidence and deeper market penetration.
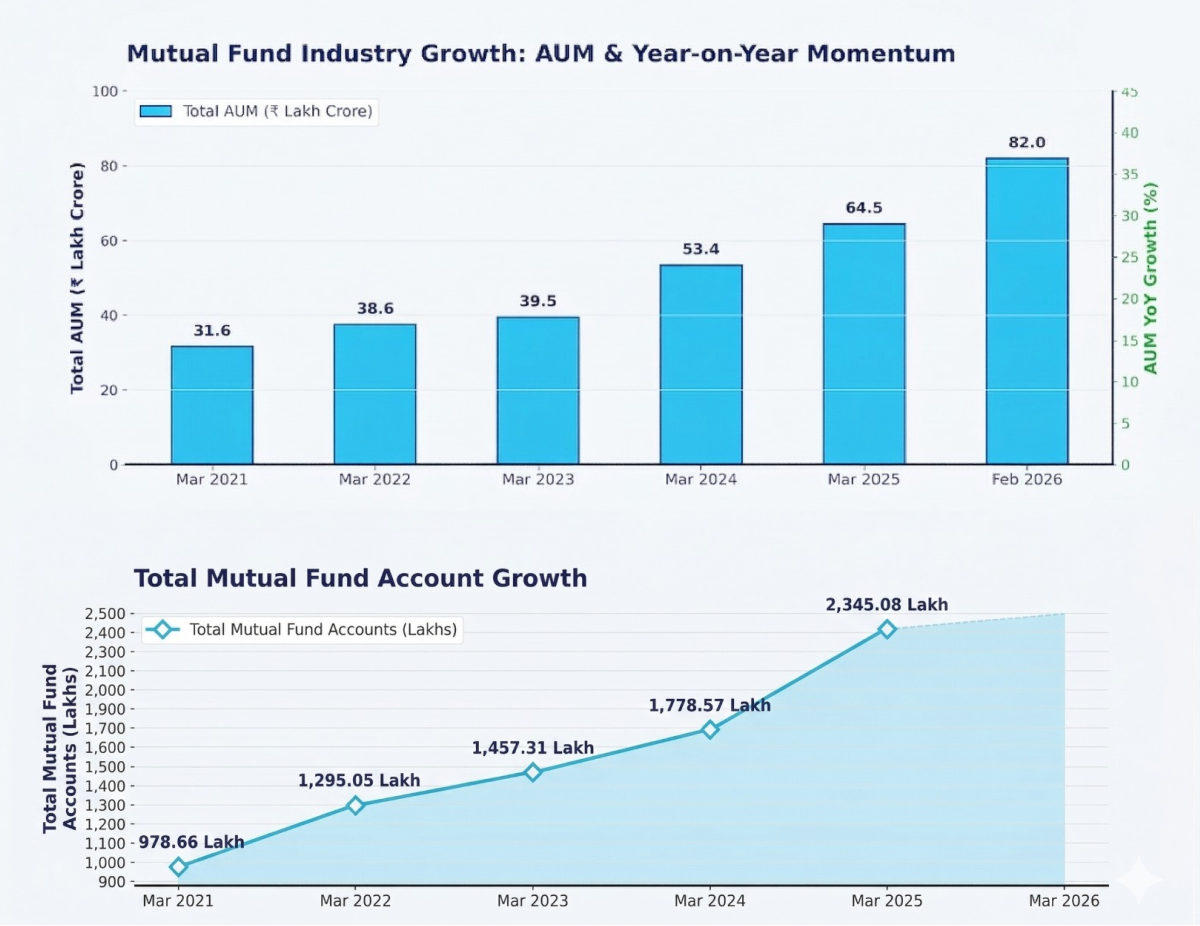
Rising Investor Participation
Investor participation has surged dramatically over the years.
- Total mutual fund accounts reached 27.06 crore
- Retail-driven mutual fund accounts stood at 20.64 crore
- The industry crossed 10 crore mutual fund accounts in May 2021
Unique investors also increased:
- Total unique investors: 6.09 crore
- Added around 70 lakh investors in one year
This indicates that mutual funds are no longer limited to urban or high-income investors. With digital platforms simplifying access, getting started today often takes just a few minutes through a seamless online account opening process.
(Source: AMFI)
SIP Boom Driving Consistent Growth
Mutual fund SIP inflows strengthened further in March 2026, extending the steady momentum in systematic investments despite volatility in overall industry assets. SIP inflows rose to ₹32,087 crore in March, up from ₹29,845 crore in February 2026, reflecting a month-on-month increase of about 7.5% or ₹2,242 crore.
This growth was accompanied by a sharp surge in net equity inflows, which climbed to ₹40,366 crore in March from ₹25,965 crore in February, marking a 55.5% increase and highlighting continued investor interest in equity-oriented schemes.
The steady rise in SIP participation shows that investors are adopting disciplined investing habits. The slight dip in contributing SIP accounts is due to February being a shorter month, with some installments processed in early March. You can start a SIP in minutes on Paytm Money.
(Source: AMFI, CNBC TV18)
Indian Mutual Fund Growth: AUM & Investor Base (2021–2026)
Category-wise AUM Growth
Different asset classes have contributed to the overall expansion.
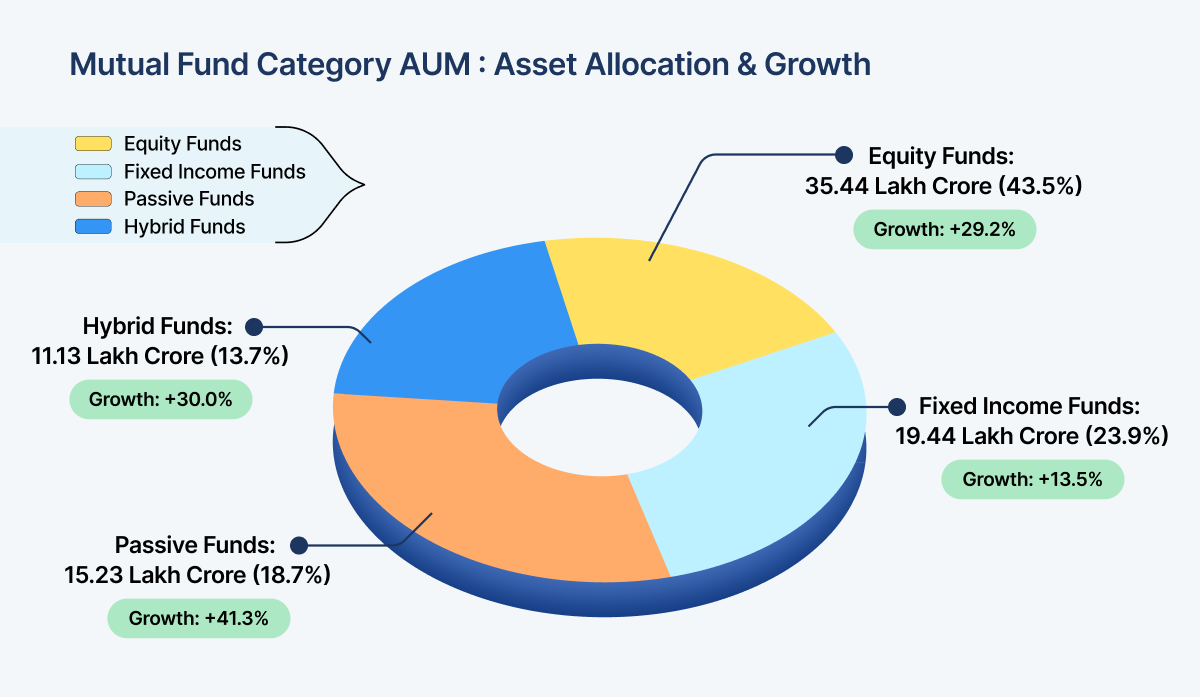
(Source: AMFI)
Key Insights:
- Equity remains the dominant growth driver
- Passive investing is gaining strong traction
- Debt funds continue to grow steadily
- Debt funds recorded net inflows of ₹42,106 crore in February
- Liquid funds led the category with inflows of ₹59,077 crore
Rise of Passive and Commodity Funds
Passive funds are becoming increasingly popular.
- Share increased to 19% from 17%
- Domestic equity passive AUM: ₹9.78 lakh crore (up 30.2%)
Despite strong inflows, passive fund AUM saw a marginal 1.1% month-on-month decline to ₹15.23 lakh crore due to mark-to-market losses.
Commodity funds saw exceptional growth:
- Gold funds: ₹1.83 lakh crore (from ₹0.56 lakh crore)
- Silver funds: ₹0.92 lakh crore, more than 6x growth
This shows diversification in investor preferences.
(Source: AMFI, Times of India)
Industry Expansion and Structural Strength
- Industry added ₹17.5 lakh crore in one year
- 5-year CAGR: 21%
- Bank deposit CAGR: 11%
Mutual funds are clearly outpacing traditional savings.
Other indicators:
- MF assets equal to 33% of bank deposits (vs 29% last year)
- Number of AMCs increased from 43 to 50
(Source: Times of India)
Direct vs Distributor Channels
Investor behaviour differs across segments.
| Segment | Direct | Distributor |
|---|---|---|
| Overall Market | 44.8% | 55.2% |
| Retail & HNI | 28% | 72% |
| Corporates | 71.9% | 28.1% |
| Banks | 93.3% | 6.7% |
Scheme Preferences:
- Equity: 72.4% via distributors
- Hybrid: 69.9% via distributors
- Debt: 75.8% via direct
This shows that while institutions prefer direct investing, retail investors still rely heavily on guidance. Multi-asset allocation funds drove the Hybrid category, attracting ₹8,476 crore, which accounted for nearly 70% of total hybrid inflows.
(Source: AMFI)
Paytm Money’s Expanding Role
As the Indian mutual fund industry growth story unfolds, digital platforms are becoming critical enablers. One such platform is Paytm Money, which has demonstrated strong and consistent growth.
Key Performance Highlights
| Metric | Achievement |
|---|---|
| Highest AUM | ₹27.25 K Cr (as of 11 Feb 2026) |
| Growth Rebound | +1.06% increase from Jan to Feb |
| Value Added | ₹618 crore added since Nov |
| Stability Level | Maintained consistently above ₹25 K Cr |
Growth Momentum
- November to December growth: 0.74%
- January dip followed by 1.06% recovery in February
This reflects strong investor confidence and consistent inflows.
(Source: Official Paytm Money Data)
Strength Indicators
- Resilience: Quick recovery from market fluctuations shows a loyal investor base.
- Stability: AUM remained above ₹25,000 crore throughout, indicating a strong foundation.
- Peak Performance: AUM reached an all-time high of ₹27.25 K Cr, growing 2.32% overall.
- Market Share Expansion: The rising AUM suggests increased penetration in the retail investment space.
What is Driving This Growth?
Several structural factors are contributing to the rapid expansion:
- Increasing financial awareness
- Strong equity market participation
- Growth in SIP investments
- Digital platforms simplifying access
- Rising disposable incomes
- Expansion in passive investing
Conclusion
The Indian mutual fund industry growth story is backed by strong numbers, rising participation, and consistent inflows. With AUM at ₹82 lakh crore and growing rapidly, the industry is entering a new phase of maturity.
Retail investors are playing a central role, supported by SIPs and digital access. Platforms like Paytm Money are further accelerating this shift by making investing more accessible and efficient.
Today, many investors prefer platforms where they can seamlessly track, plan, and invest. Whether it is estimating returns through a SIP calculator or getting started with a demat account, digital platforms like Paytm Money are making the entire journey simple and accessible.
Disclaimer: Mutual fund investments are subject to market risks. Read all the related documents carefully before investing. This content is purely for information purpose only and in no way is to be considered as an advice or recommendation. The securities are quoted as an example and not as a recommendation. Investors are requested to do their own due diligence before investing.
SEBI Reg No.: Broking – INZ000240532, Research Analyst – INH000020086, Depository Participant – IN-DP-416-2019, Depository Participant Number: CDSL – 12088800, NSE (90165), BSE (6707), MCX (57525), NCDEX (1315), MSEI (85300).
Registered Office: 136, 1st Floor, Devika Tower, Nehru Place, Delhi – 110019.
For complete Terms & Conditions and Disclaimers, visit https://www.paytmmoney.com.