

So you have finally decided to buy an ETF. You open your trading app, punch in the quantity, tap the button, and then the order fills at a price that sits a little higher than you expected. Sound familiar? If you have ever wondered why your buy or sell never quite matched the number on screen, the answer usually comes down to one quiet little detail: the bid-ask spread.
- What Is the Bid-Ask Spread?
- How to Read the Bid-Ask Spread
- Working Out the Percentage Spread
- Why the Bid-Ask Spread Matters for ETFs
- What Drives the Bid-Ask Spread
- Trading Volume: A Misleading Indicator?
- The Role of Market Makers and Authorised Participants
- How the Spread Hits Your Buying and Selling Price
- How Retail Investors Can Trade ETFs More Efficiently
- Conclusion
- FAQs
Exchange-Traded Funds are popular in India for good reason: they are low-cost, flexible, and transparent. Yet most first-time buyers fixate on returns and expense ratios while ignoring how easily a fund can actually be traded. That is a costly blind spot, because the bid-ask spread can slowly nibble away at your gains. Let us break it down in plain language.
What Is the Bid-Ask Spread?
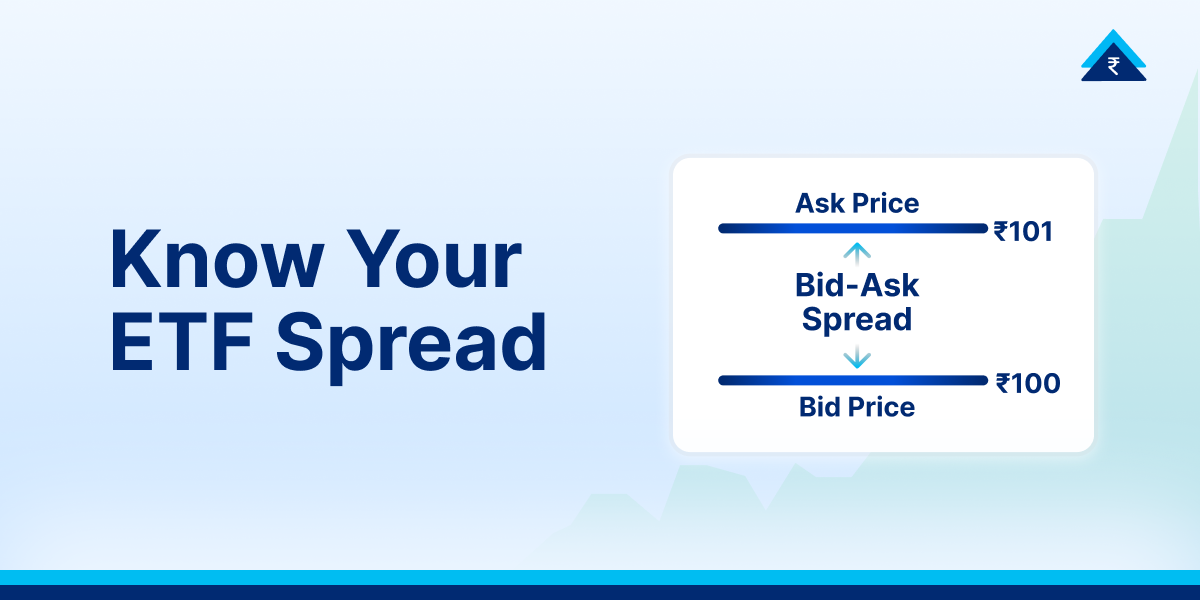
The bid-ask spread is simply the gap between the highest price a buyer is willing to pay and the lowest price a seller is willing to accept. It sits at the heart of every trade you place.
Two prices create it:
- Bid price: the top price buyers are prepared to pay. This is the demand side of the market.
- Ask price: the lowest price sellers will accept, also called the offer price. This is the supply side.
The difference between the two is the bid-ask spread. Buyers want to pay less and sellers want to receive more, so a gap almost always exists. That gap is a useful signal. A narrow bid-ask spread generally indicates better liquidity, while a wider spread can indicate lower liquidity, greater volatility or less competitive pricing.
How to Read the Bid-Ask Spread
Beginners often see bid and ask figures flashing on their screen without knowing what to do with them. Here is a quick worked example.
| Detail | Value |
|---|---|
| Bid price | ₹1,250 |
| Bid quantity | 800 shares |
| Ask price | ₹1,253 |
| Ask quantity | 600 shares |
Buyers here are willing to pay up to ₹1,250, while sellers are willing to sell at ₹1,253 or higher. The bid-ask spread is therefore ₹1,253 − ₹1,250 = ₹3.
A market buy order will generally execute against available sell orders starting from the ask price, while a market sell order will generally execute against available buy orders starting from the bid price. However, larger orders can be filled across multiple price levels if there is not enough quantity at the best available price.
Working Out the Percentage Spread
Rupee values alone can mislead, so traders often express the bid-ask spread as a percentage. The formula is:
Bid-Ask Percentage Spread = ((Ask Price − Bid Price) ÷ Mid Price) × 100
where Mid Price = (Bid Price + Ask Price) ÷ 2
Say a security shows a bid of ₹495 and an ask of ₹505.
- Mid price = (495 + 505) ÷ 2 = ₹500
- Spread = ₹505 − ₹495 = ₹10
- Percentage spread = (10 ÷ 500) × 100 = 2%
The bid-ask spread here equals 2% of the average price. Using a percentage lets you compare costs fairly across securities that trade at very different price levels.
Why the Bid-Ask Spread Matters for ETFs
With ETFs, the bid-ask spread represents a cost of trading immediately. Picture a fund quoted like this:
- Bid price: ₹190
- Ask price: ₹200
- Bid-ask spread = ₹200 − ₹190 = ₹10
- Midpoint = (₹200 + ₹190) ÷ 2 = ₹195
- Percentage spread = (₹10 ÷ ₹195) × 100 = 5.13%
A 5.13% spread is very wide and can indicate low liquidity, limited trading activity or greater uncertainty in the ETF’s pricing. Tighter spreads, by contrast, generally indicate better liquidity and lower trading costs. Always check the bid-ask spread before placing an ETF order, because a wide spread can eat into your returns, particularly for short-term trades or larger orders.
What Drives the Bid-Ask Spread
Several forces push the bid-ask spread wider or narrower.
| Factor | Effect on the spread |
|---|---|
| Liquidity of holdings | Highly liquid, actively traded securities tend to keep spreads narrow. |
| Trading volume | Higher trading activity and more active participation from buyers and sellers generally help narrow spreads. |
| Market volatility | Events such as RBI policy announcements or major market events can widen spreads. |
| Company or fund size | Large, established ETFs usually trade with tighter spreads, although size alone does not determine liquidity. |
| Market timing | Spreads often widen near the market open and close, when price movements and order-flow changes can be greater. |
Trading Volume: A Misleading Indicator?
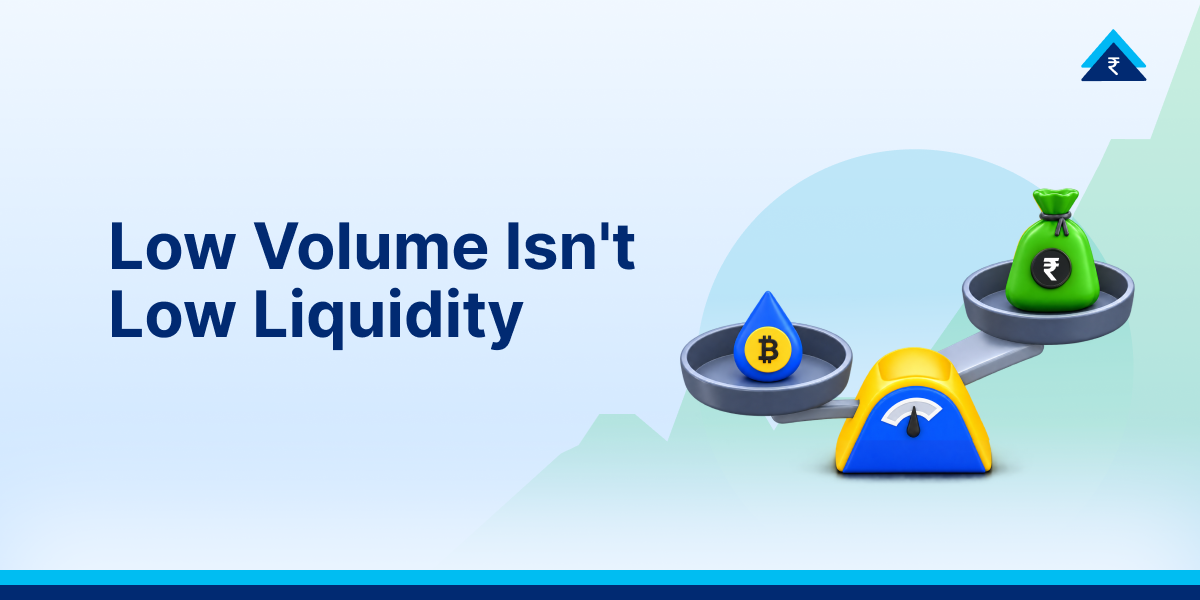
Many investors assume high daily volume automatically means good liquidity. For ETFs, that is only half the story. Unlike ordinary shares, ETF liquidity is influenced not only by trading on the exchange but also by the liquidity of the ETF’s underlying securities. Even if a fund rarely changes hands on screen, Authorised Participants can still create or redeem units in the primary market. So a low-volume ETF can still be very liquid if the assets it holds are liquid.
Take an ETF tracking the Nifty 50. Its daily volume may look modest, yet because Nifty 50 stocks trade heavily, market makers can still quote competitive prices. So do not judge a fund by volume alone. Also check the bid-ask spread, any premium or discount to NAV, and the liquidity of the underlying assets.
Note: In low-volume ETFs, consider using limit orders rather than market orders so you have greater control over the price at which your order executes.
The Role of Market Makers and Authorised Participants
ETF liquidity works because of two key players operating quietly in the background.
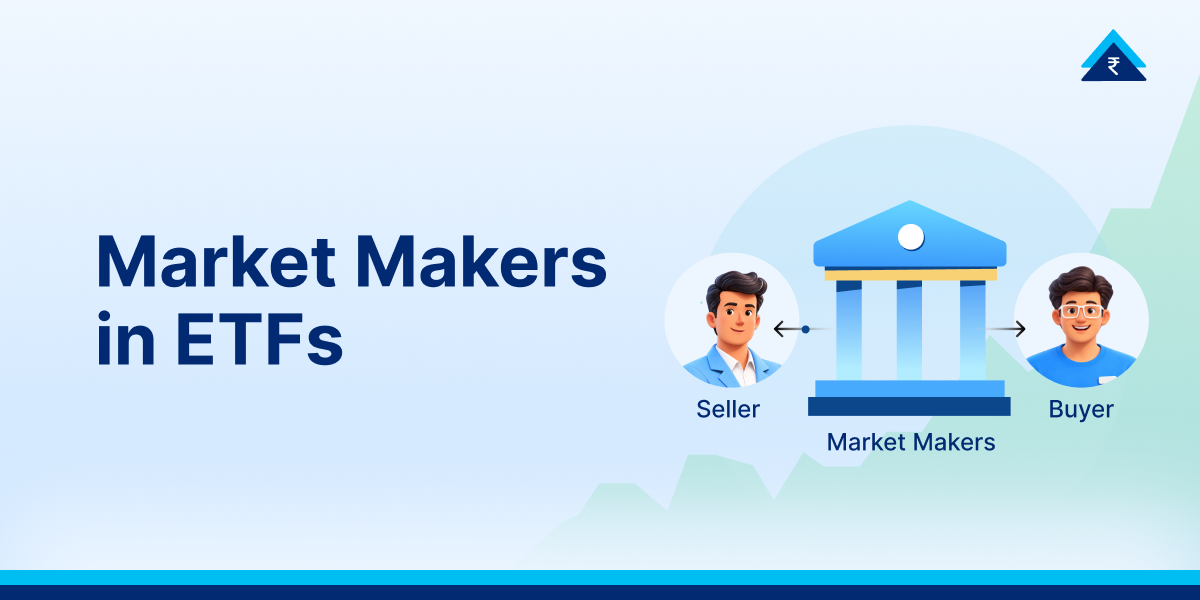
- Market makers are financial institutions that provide buy and sell quotes on the exchange, helping maintain an active market for the ETF. They aim to earn from the bid-ask spread while managing the risks involved in holding inventory.
- Authorised Participants (APs) are large institutions appointed by the fund issuer. They can create and redeem ETF units in large blocks, known as creation units, by exchanging a specified basket of underlying securities, cash, or a combination of both, depending on the ETF’s structure.
Together, market makers and APs help support liquidity, facilitate arbitrage and keep an ETF’s market price closely aligned with the value of its underlying holdings. This can help provide liquidity even when on-screen trading volume is relatively low and reduce the price impact of trades. You may never see them at work, but their activity can influence the price at which your ETF order is executed.
How the Spread Hits Your Buying and Selling Price
The bid-ask spread carries a real rupee cost. Suppose a security shows:
- Bid price = ₹300
- Ask price = ₹304
Buy at once and you may pay ₹304. Sell straight after, with no change in the market price, and you may receive only ₹300. That is an instant ₹4 difference per share. Buy 1,000 shares and the spread represents ₹4,000 of potential round-trip trading cost. This is why traders pay close attention to the spread before placing an order.
How Retail Investors Can Trade ETFs More Efficiently
- Check the bid-ask spread first: If it looks wide, consider using a limit order to control your maximum buying price or minimum selling price.
- Do not rely only on daily volume: Check whether the fund tracks a liquid index and whether trading activity remains consistent over time, rather than judging liquidity from a single day’s volume.
- Use limit orders: They give you greater control over your entry and exit prices, which can be useful for wide-spread or low-volume ETFs where market orders may result in slippage.
- Be mindful of the open and close: The first and last 15 minutes can experience greater volatility or wider spreads. Mid-day trading can often offer more stable market conditions.
- Review the underlying holdings: An ETF tracking a highly liquid index such as the Nifty 50 or Sensex may have good underlying liquidity even when its own trading volume is relatively low.
- Track premium or discount to NAV: Large or persistent gaps may warrant further investigation, as they can reflect market conditions, liquidity constraints or differences in the timing of ETF and underlying-asset prices.
Conclusion
ETFs are low-cost and flexible, but sloppy execution can quietly shrink your returns. Rather than chasing popularity or past performance alone, weigh up the liquidity signals too. Watch the bid-ask spread, keep an eye on NAV, consider how liquid the underlying holdings are, and lean on limit orders for control. Get these basics right and you will trade ETFs more cheaply and much closer to fair value.
Disclaimer: Investments in the securities market are subject to market risks. Read all the related documents carefully before investing. This content is purely for informational purposes only and should not be considered as investment advice or a recommendation. Securities quoted are for illustration purposes only and not recommendatory. Investors are requested to do their own due diligence before investing.
Paytm Money Ltd. SEBI Reg. No. Broking – INZ000240532; Depository Participant – IN – DP – 416 – 2019, Depository Participant Number: CDSL – 12088800. Trading and clearing member of NSE (90165, M52073), BSE (6707), MCX (57525), NCDEX (1315, M51110), and MSEI (85300). SEBI Reg. No. Research Analyst – INH000020086. Regd. Office: 136, 1st Floor, Devika Tower, Nehru Place, Delhi – 110019. For complete Terms & Conditions and Disclaimers visit: https://www.paytmmoney.com/stocks/policies/terms