The first step towards making you an informed and proactive trader/investor is by providing all relevant information for a scrip that will aid your buy/sell decision. So, here we are! Not only can you check out all information related to the company of your choice, but also set triggers and SIPs from the company page.
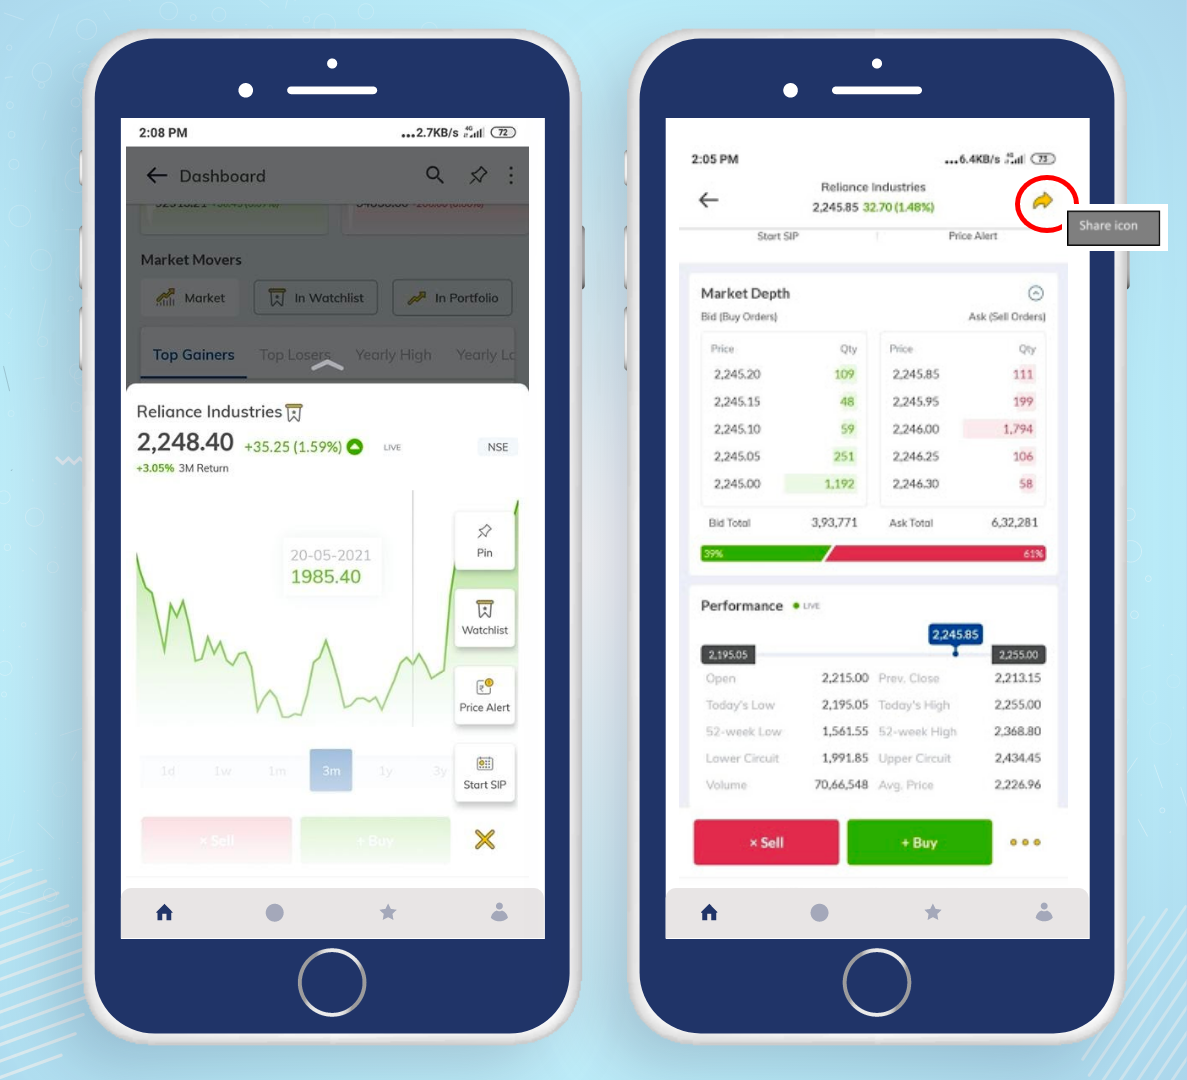
To access company page, all you have to do is click on a scrip, either from Market Movers or using the search functionality. You can BUY/SELL the scrip from its company page.
Charts
Charts are the first thing that you will see on the company page. By default, mountain charts are visible. If you want to view advanced charts, then you can click on the chart icon next to the mountain graphs.
Market Depth
Market depth shows the Ask and Bid order quantities at multiple price points for a particular scrip. This will help you gauge the market perception about the scrip.
Performance
The performance card shows you all the Open, High, Low, Close values for the scrip, along with 52-week High/Low and Upper and Lower circuit values. All of these are significant numbers for intraday traders. There is a dynamic bar that shows the 52-week performance of the scrip.
Price Alerts
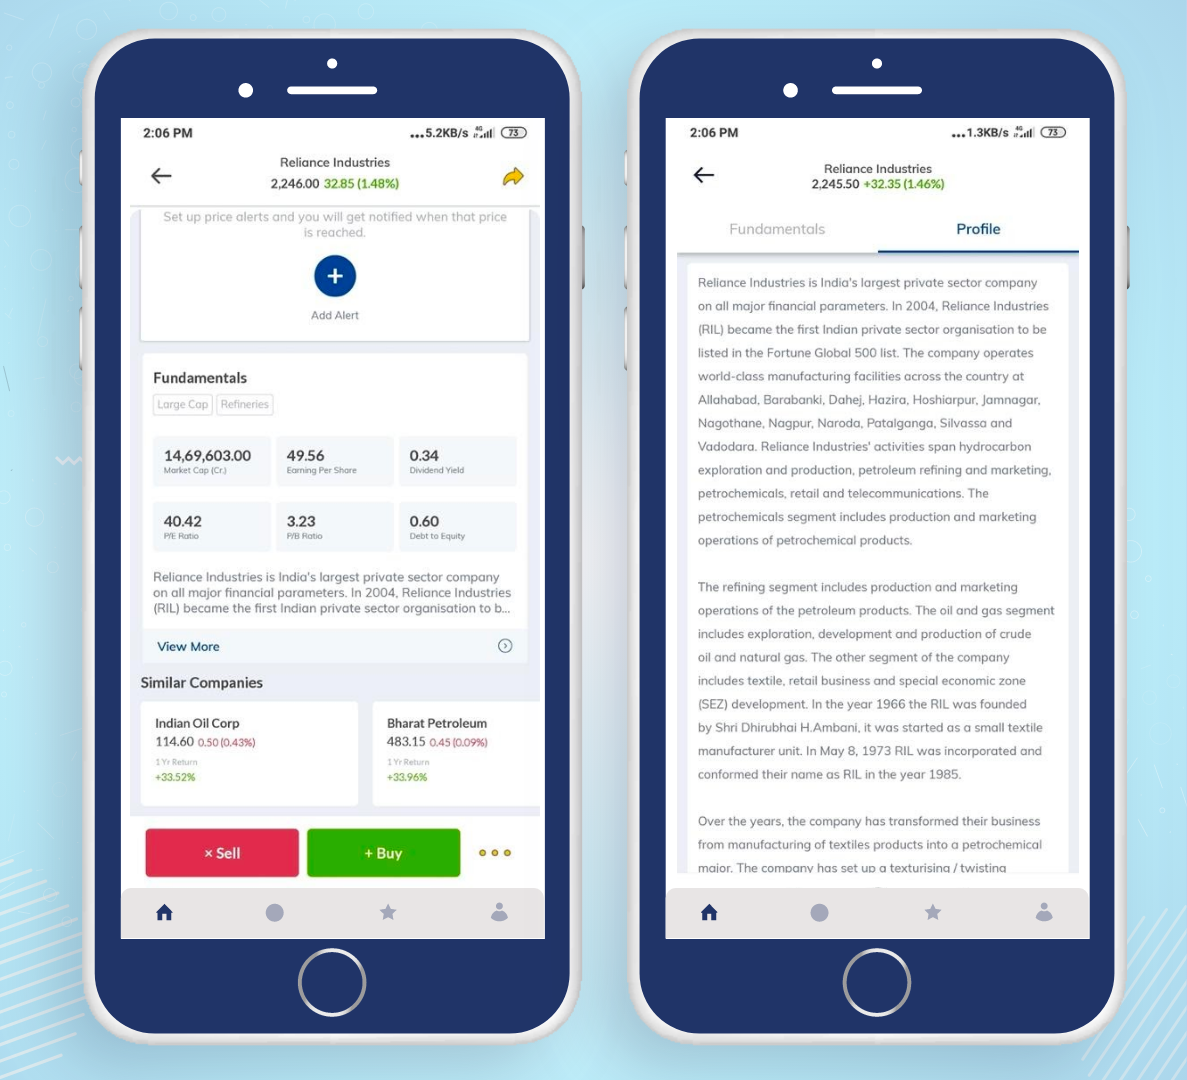
This is an interesting feature within Paytm Money company page. You can also access it next to Buy Sell tabs. It allows you to set an alert for a particular price point of a scrip, whenever it is reached. You will receive an email and a push notification and can place your trade accordingly.
SIPs
Stock SIP is a feature that can only be found in Paytm Money. If you are a regular investor and have handpicked a set of scrips to invest in, then you can set your SIP for a stock, very similar to how you do for mutual funds.
Fundamentals
Company fundamentals are something that all investors look for before putting their money on a stock. If a company is performing well, then its fundamentals will reflect so, and you can make an informed choice. In Paytm Money company page, you are shown the following fundamentals:
Market Cap – total market capitalization value of the company
Earnings per Share – high EPS means the company is performing well
Dividend Yield – this measures the dividend paid to shareholders relative to market value of share. You can choose a stock that pays good dividend.
Price to Earnings ratio – typically, ow P/E means the stock is undervalued, and it is good for investing
Price to Book ratio – typically, low P/B means the company is undervalued, and it is good for investing
Debt to Equity – lower debt to equity ratio indicates that the company is exposed to lower interest rate risk and is more eligible for credit.
About
The About or Profile section lists everything that is to be known about the company. If you want to know more about the inception of a company and similar information, then this is the section for you.
Similar Companies: This section shows a series of similar scrips which belong to the same sector.
There’s more..
You can also share a stock with your friends and family using the share icon!
Conclusion
Paytm Money app offers information like company fundamentals, charts, performance and so on on its stock page. Users can also set stock SIPs and set price alerts. Explore the page of your favourite stock today!
Disclaimer – “Investment in securities market are subject to market risks, read all the related documents carefully before investing. The securities quoted are exemplary and are not recommendatory.
Paytm Money Ltd SEBI Reg No. Broking – INZ000240532. NSE (90165), BSE(6707) Regd Office: 136, 1st Floor, Devika Tower, Nehru Place, Delhi – 110019. For complete Terms & Conditions and Disclaimers visit www.paytmmoney.com.”