Want to view candles for multiple time intervals?
Want to plot trendlines to gauge market behavior?
Want to compare charts, to see how a certain stock is performing with respect to another?
Here is an answer to all the questions!
Charts in Paytm Money is a one-stop solution to your trading needs.
It is convenient to use, super intuitive, and seamless to navigate through, all of which make it a significant offering for any trader. You can use charts for determining precise buy points, use several indicators to measure stock performance, customize views according to your needs, and so on.
To access charts, all you have to do is click on a scrip from Market Movers or simply use the search button.
Steps to follow
- Log in to Paytm Money app or website
- Go to Stocks page
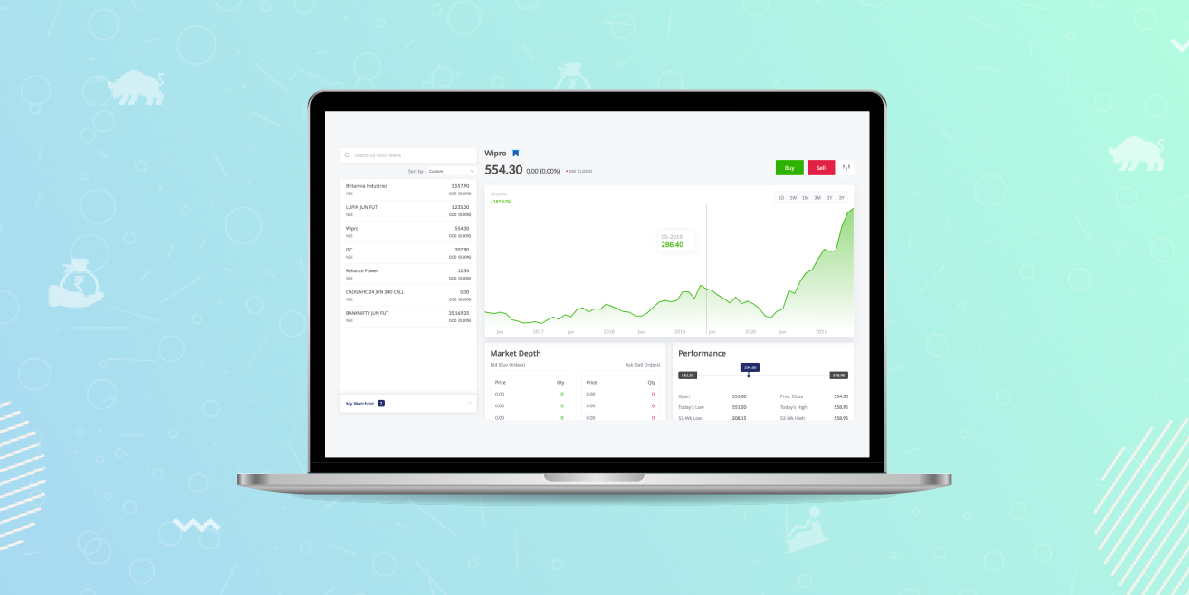
- Click on any scrip by searching the scrip or accessing it from market movers/ watchlist/ portfolio. The Mountain graph will show up.
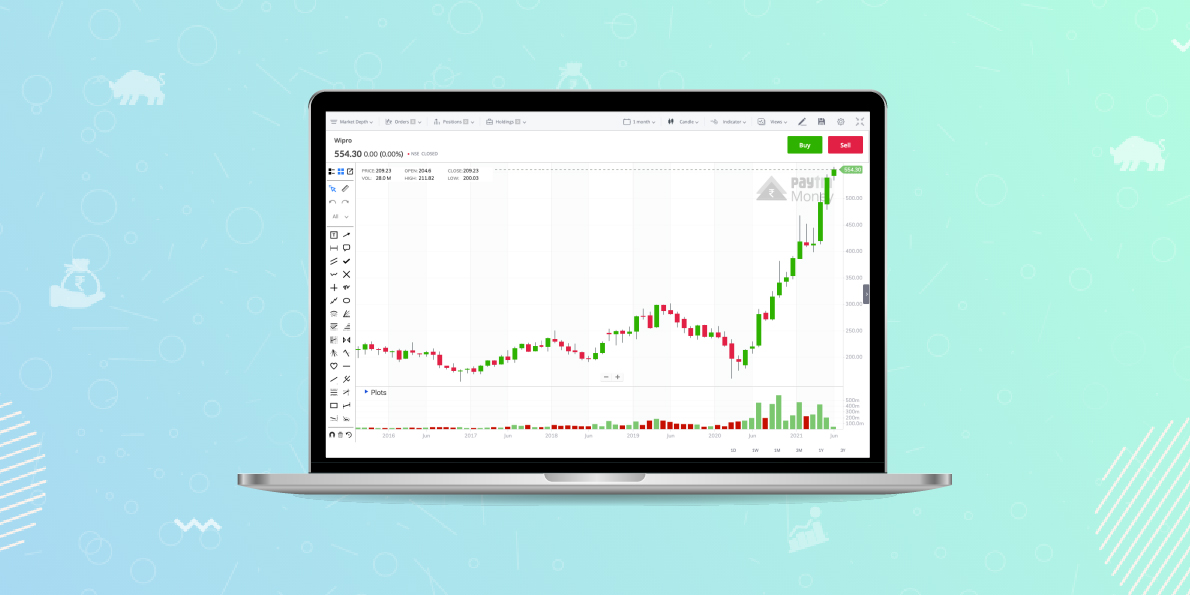
For accessing advanced charts, you need to click on the chart icon present at the bottom of mountain graphs. You can see a full-page version of the advanced charts.
On app, both portrait and landscape mode are available for viewing charts
You can BUY and SELL from the charts page itself
Charts are designed in such a manner that the color of the mountain graph changes according to the movement of stock price, for various time intervals. In order to view the price point, you can click on the graph and a tooltip shows the scrip price.
You can Pin a scrip, add it to your watchlist, set up a price alert, or start SIP, all from charts.
Let’s dig deep into the offerings in Advanced Charts
Candle duration and ranges: If you are an intraday trader, then candles are something you cannot do without.
Candles help to see Open, High, Low and Close values of the scrip in a particular interval.
They are coloured green when open is greater than close and red for vice-versa.
In Paytm Money, there are candles starting from 1 min to 1 month for durations as long as 5 years. You can Zoom In/Out using the +/- signs on charts.
Apart from candles, there are other types of graphs available: Line, Bar, Coloured Bar, Hollow Candle, Baseline, and some advanced ones like Heikin Ashi, Renko, etc.
Market depth and order
If you are viewing charts, and you still want to keep track of market performance, there is a functionality that enables you to do so. You can see the market depth and performance, view your orders, positions and holdings, all from the charts page. Additionally, users can place an order while viewing the chart in a click on “buy/sell” button on the chart screen.
Indicators
You can add multiple indicators to the charts that will aid your trading/investing decisions. Paym Money has 120 indicators.
There is an extensive list of indicators to choose from – Volume, Moving Average (MA), Relative Strength Indicator (RSI), etc.
For selecting an indicator, all you have to do is choose one from the dropdown of indicators.
For deselecting, you can simply click on the “X” icon from the dropdown
Drawing Tools
There are many tools available for drawing on the charts: average line, cross line, Elliot wave, regression, etc.
You simply have to click on the pencil icon to access these.
In case you want to remove a drawing, then right click on that particular tool and delete it.
Views
You can now save your favourite view with multiple indicators. All you have to do is Click on ‘Save View’ and name it. You can now easily access the saved formats from ‘Views’ Dropdown.
How to Save Views
Compare Charts
This allows you to compare how one scrip is performing vis-à-vis another. You can add up to 2 scrips on app and up to 4 scrips on web for comparing.
How to Compare Charts
Advanced Charts
Mountain graph
Conclusion
Paytm Money’s team has worked day in and day out to get advanced trading tools such as charts at your fingertips. You can research, set indicators, draw and compare charts.
Disclaimer
“Investment in securities market are subject to market risks, read all the related documents carefully before investing. The securities quoted are exemplary and are not recommendatory.
Paytm Money Ltd SEBI Reg No. Broking – INZ000240532. NSE (90165), BSE(6707) Regd Office: 136, 1st Floor, Devika Tower, Nehru Place, Delhi – 110019. For complete Terms & Conditions and Disclaimers visit www.paytmmoney.com.”